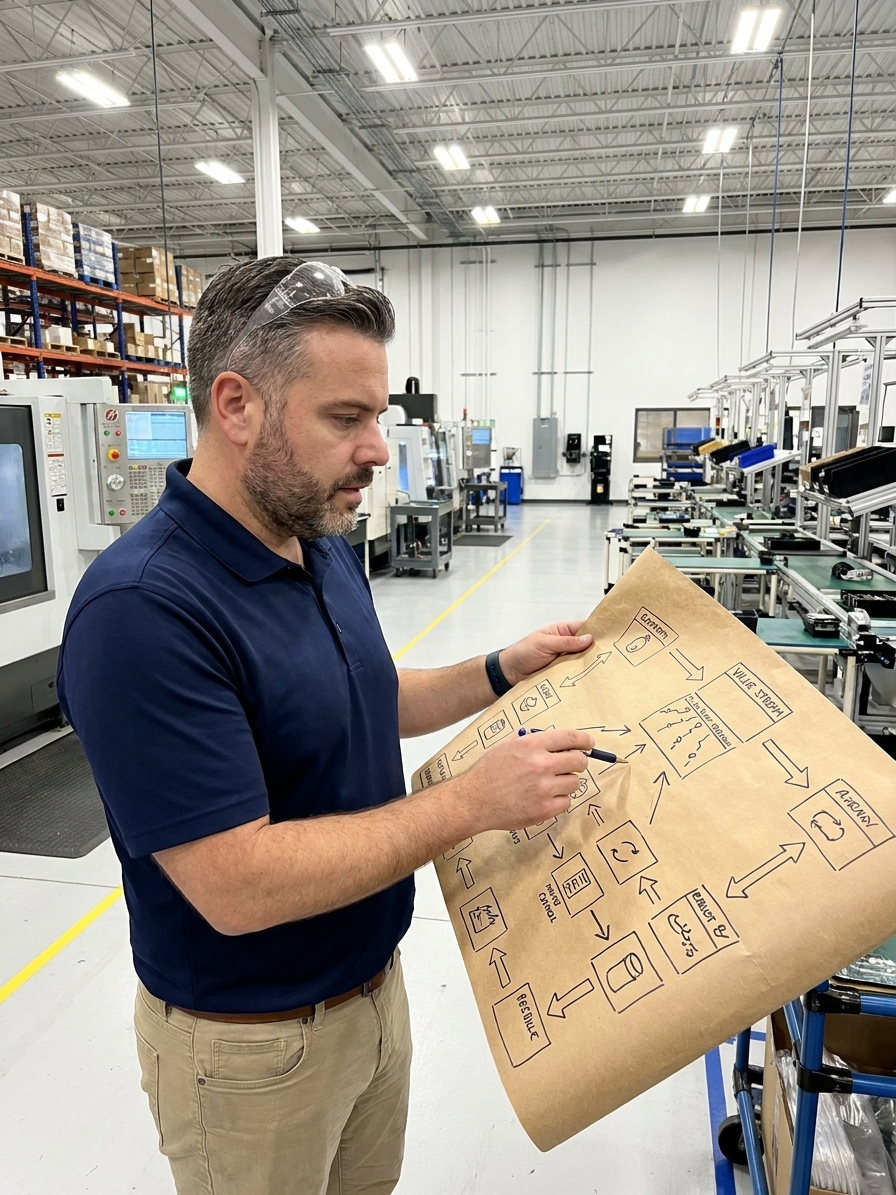
The standard Value Stream Mapping (VSM) workshop follows a predictable arc. A consultant arrives with brown paper and sticky notes. The team spends three days on the factory floor with a stopwatch, sketching boxes, triangles, and arrows that capture the production process. The finished map stretches across an entire conference room wall. The cycle times are recorded, the lead times calculated, and the process cycle efficiency computed. At 4%, everyone nods solemnly at how terrible that number is.
Then the consultant leaves. The brown paper stays on the wall for six weeks until someone needs the conference room for a customer presentation. The map is photographed for documentation purposes, rolled up, and placed in a filing cabinet. The waste it was supposed to eliminate remains. The bottlenecks it revealed are still bottlenecking. The future state map exists only as a faint memory in the minds of the three people who understood the symbols.
This is the reality of Value Stream Mapping in most manufacturing organisations. Not the success story told at lean conferences, but the story where a powerful diagnostic tool becomes an exercise in cartography that changes nothing on the floor. I have audited plants where a rolled-up VSM sat in the manager's office for three years, completely untouched, while the exact same queueing bottlenecks it identified continued to drive scrap and late deliveries. The map is a diagnostic tool, not a deliverable. Treating it as a deliverable is the most expensive failure mode in lean manufacturing.
The Diagnostic Map Is Not the Deliverable
VSM was developed at Toyota as part of the Toyota Production System and introduced to Western audiences through the book 'Learning to See' by Mike Rother and John Shook. It creates a visual representation of the entire flow of materials and information required to bring a product from raw material to customer delivery. The current state map documents what actually happens today—not what the standard work says should happen, but the messy, inefficient reality of how work flows.
The purpose of the exercise is never to create the map. The purpose is to use the map to identify waste, design a future state with that waste eliminated, and execute a transformation plan to close the gap. Each process step is drawn as a box. Inventory between steps is drawn as triangles. Information flows are drawn as straight lines. Physical material flows are drawn as broad arrows. At the bottom of the map, a timeline divides into processing time and wait time.
In most organisations, the map becomes the deliverable, and the transformation never happens. The current state map is useless without a future state map. The future state map is useless without an implementation plan. The implementation plan is useless without execution. Stopping after the first step is the most common failure mode in the history of lean deployment.

Mapping From Memory Instead of the Floor
The second major failure mode is creating the map from memory or from process documentation rather than from direct observation. A team sits in a conference room and reconstructs what they think the process looks like. They draw boxes representing steps they have not physically observed in months. They estimate cycle times from standard work documents that were outdated the day they were written.
They draw inventory levels from ERP data that bears only a passing resemblance to what is actually sitting on the factory floor. Rother and Shook were explicit about this: you must go to the gemba. You must walk the actual process. You must time the actual cycles with a stopwatch. You must count the actual inventory. A value stream map created from secondhand information is a work of fiction, and basing your improvement plan on fiction is how you fix a process that was never the problem.
Organisations often try to map too much in a single exercise. They attempt to capture an entire facility's worth of processes on one map, creating a document so complex that nobody can extract actionable insight from it. Or they map at such a high level that the detail needed to identify waste is invisible. The effective approach is to define a product family—a group of products that share similar processing steps—and map only that family's value stream.
This produces a focused, manageable map that reveals specific waste in a specific flow. Mapping everything at once produces a mural. Mapping a product family produces a tool. Targeting a specific family also directly supports your IATF 16949 or AS9100 high-volume production lines, where a 10% reduction in wait time translates into measurable gains in on-time delivery and inventory carry costs.
The Future State Map That Never Comes
Even organisations that successfully create an accurate current state map often stumble at the future state stage. The future state map is supposed to represent what the value stream could look like after waste is eliminated, continuous flow is established, and pull systems are implemented. It requires imagination, technical knowledge, and a willingness to challenge assumptions about how things must be done.
What typically happens is the future state map is never created, or it represents such a modest improvement that it barely differs from the current state. The team is so anchored to how things are that they cannot envision how things could be. The future state map becomes a current state map with slightly fewer inventory icons. If the future state does not require fundamental changes to your PFMEA or your material handling routes, you have not actually designed a future state. You have drawn a slightly cleaner version of the present.
Even when a future state is designed, the transformation plan fails. The map is drawn, the future state is designed, the gaps are identified. Then the kaizen events that are supposed to close the gaps are never scheduled, or they are scheduled but not staffed, or staffed but not funded. Or they are funded, but the operational metrics that measure success have not changed, so the team defaults to optimising for the old local efficiencies rather than the overall flow.
The VSM Execution Sequence
- 01Select Product FamilyChoose a family based on strategic volume and impact, not departmental convenience.
- 02Walk the Floor (Gemba)Time actual cycles with a stopwatch and count physical inventory.
- 03Draft Current StateDocument reality, not what standard work documents or ERP data claims.
- 04Design Future StateEngineer a flow that forces structural changes to routing and layout.
- 05Execute & MeasureAssign named owners, fund the changes, and track lead time reductions.
The Timeline That Should Terrify You
The most powerful element of a value stream map is the timeline at the bottom. It splits each process step into value-added time—the time actually spent transforming the product in ways the customer pays for—and non-value-added time. The non-value-added time encompasses waiting, moving, inspecting, reworking, and storing. The process cycle efficiency, which is value-added time divided by total lead time, is the single most humbling number in manufacturing.
Typical process cycle efficiencies in discrete manufacturing operations range from 1% to 5%. For every 100 hours a product spends in a facility, between 1 and 5 hours involve actual transformation. The other 95 to 99 hours involve waiting. Not processing. Not being transported with purpose. Not being inspected to ensure quality to IATF or AS9100 standards. Waiting.
A map drawn once and never referenced is a dead document regardless of how accurate its icons are.
This number should drive an immediate and aggressive effort to eliminate the wait. Instead, the typical management response is an acknowledgement of the waste, followed by no action whatsoever. The process ratio is filed away alongside the map that produced it. Organisations that benefit from VSM treat this ratio not as an interesting data point but as an unacceptable condition that demands structural layout changes and line balancing.
Digital Mapping and the Illusion of Progress
Digital VSM software has added a new dimension to the failure modes. On the positive side, digital tools make it easier to update maps, share them across multi-site locations, and link them to continuous improvement trackers. On the negative side, they introduce the risk that the technology becomes the focus rather than the underlying operational work.
A digital value stream map built entirely from ERP data without floor validation is no more accurate than a paper map drawn from memory. A beautifully rendered digital dashboard shared in a management webinar, but never printed and walked through on the factory floor, has no more impact than a brown paper map rolled up in a filing cabinet. The medium does not determine the value. The method and the floor-level validation determine the value.
Floor-Validated Mapping vs. ERP-Driven Fiction
What teams do
- Extract cycle times from SAP routing files
- Use ERP inventory levels for triangle data
- Assume standard work reflects daily reality
- Present the compiled digital map remotely
What works
- Time actual machine cycles with a stopwatch
- Count physical WIP bins between operations
- Document offline repairs and off-process rework
- Validate the map by walking it with operators
The most sophisticated digital VSM tools connect directly to manufacturing execution systems (MES) and IoT sensors on equipment, providing near-real-time cycle time data. This genuinely eliminates the need for manual time studies and provides continuous data. But the data is only valuable if someone acts on it. A real-time dashboard showing a 2% process cycle efficiency is an improvement over a paper map, but only if leadership looks at it and funds the structural changes required to fix it.
The Leadership Commitment Required
The failure of Value Stream Mapping in most organisations is a leadership failure, not a technical failure. The method is well-documented. The symbols are standardised. The training is widely available. What is missing is leadership commitment to act on what the map reveals. A leader who commissions a value stream map must be prepared to fund the improvements it identifies, staff the cross-functional projects it requires, and change the operational metrics it necessitates.
A leader who is not prepared for those commitments should not commission the map. Creating a map without the intention of acting on it is worse than not mapping at all—it creates the illusion of improvement activity while the process continues to waste 95% of its lead time. The question for every executive considering a VSM initiative is not whether they can create a map. The question is whether they are prepared to change what the map shows them.
If the answer is yes, VSM remains one of the most powerful diagnostic tools in the lean quality toolkit. It can reveal waste that has become invisible through familiarity. It can align an organisation around a shared, factual understanding of how work flows. And it can provide the data foundation for a transformation that actually transforms, driving down lead times and driving up process capability across the board.