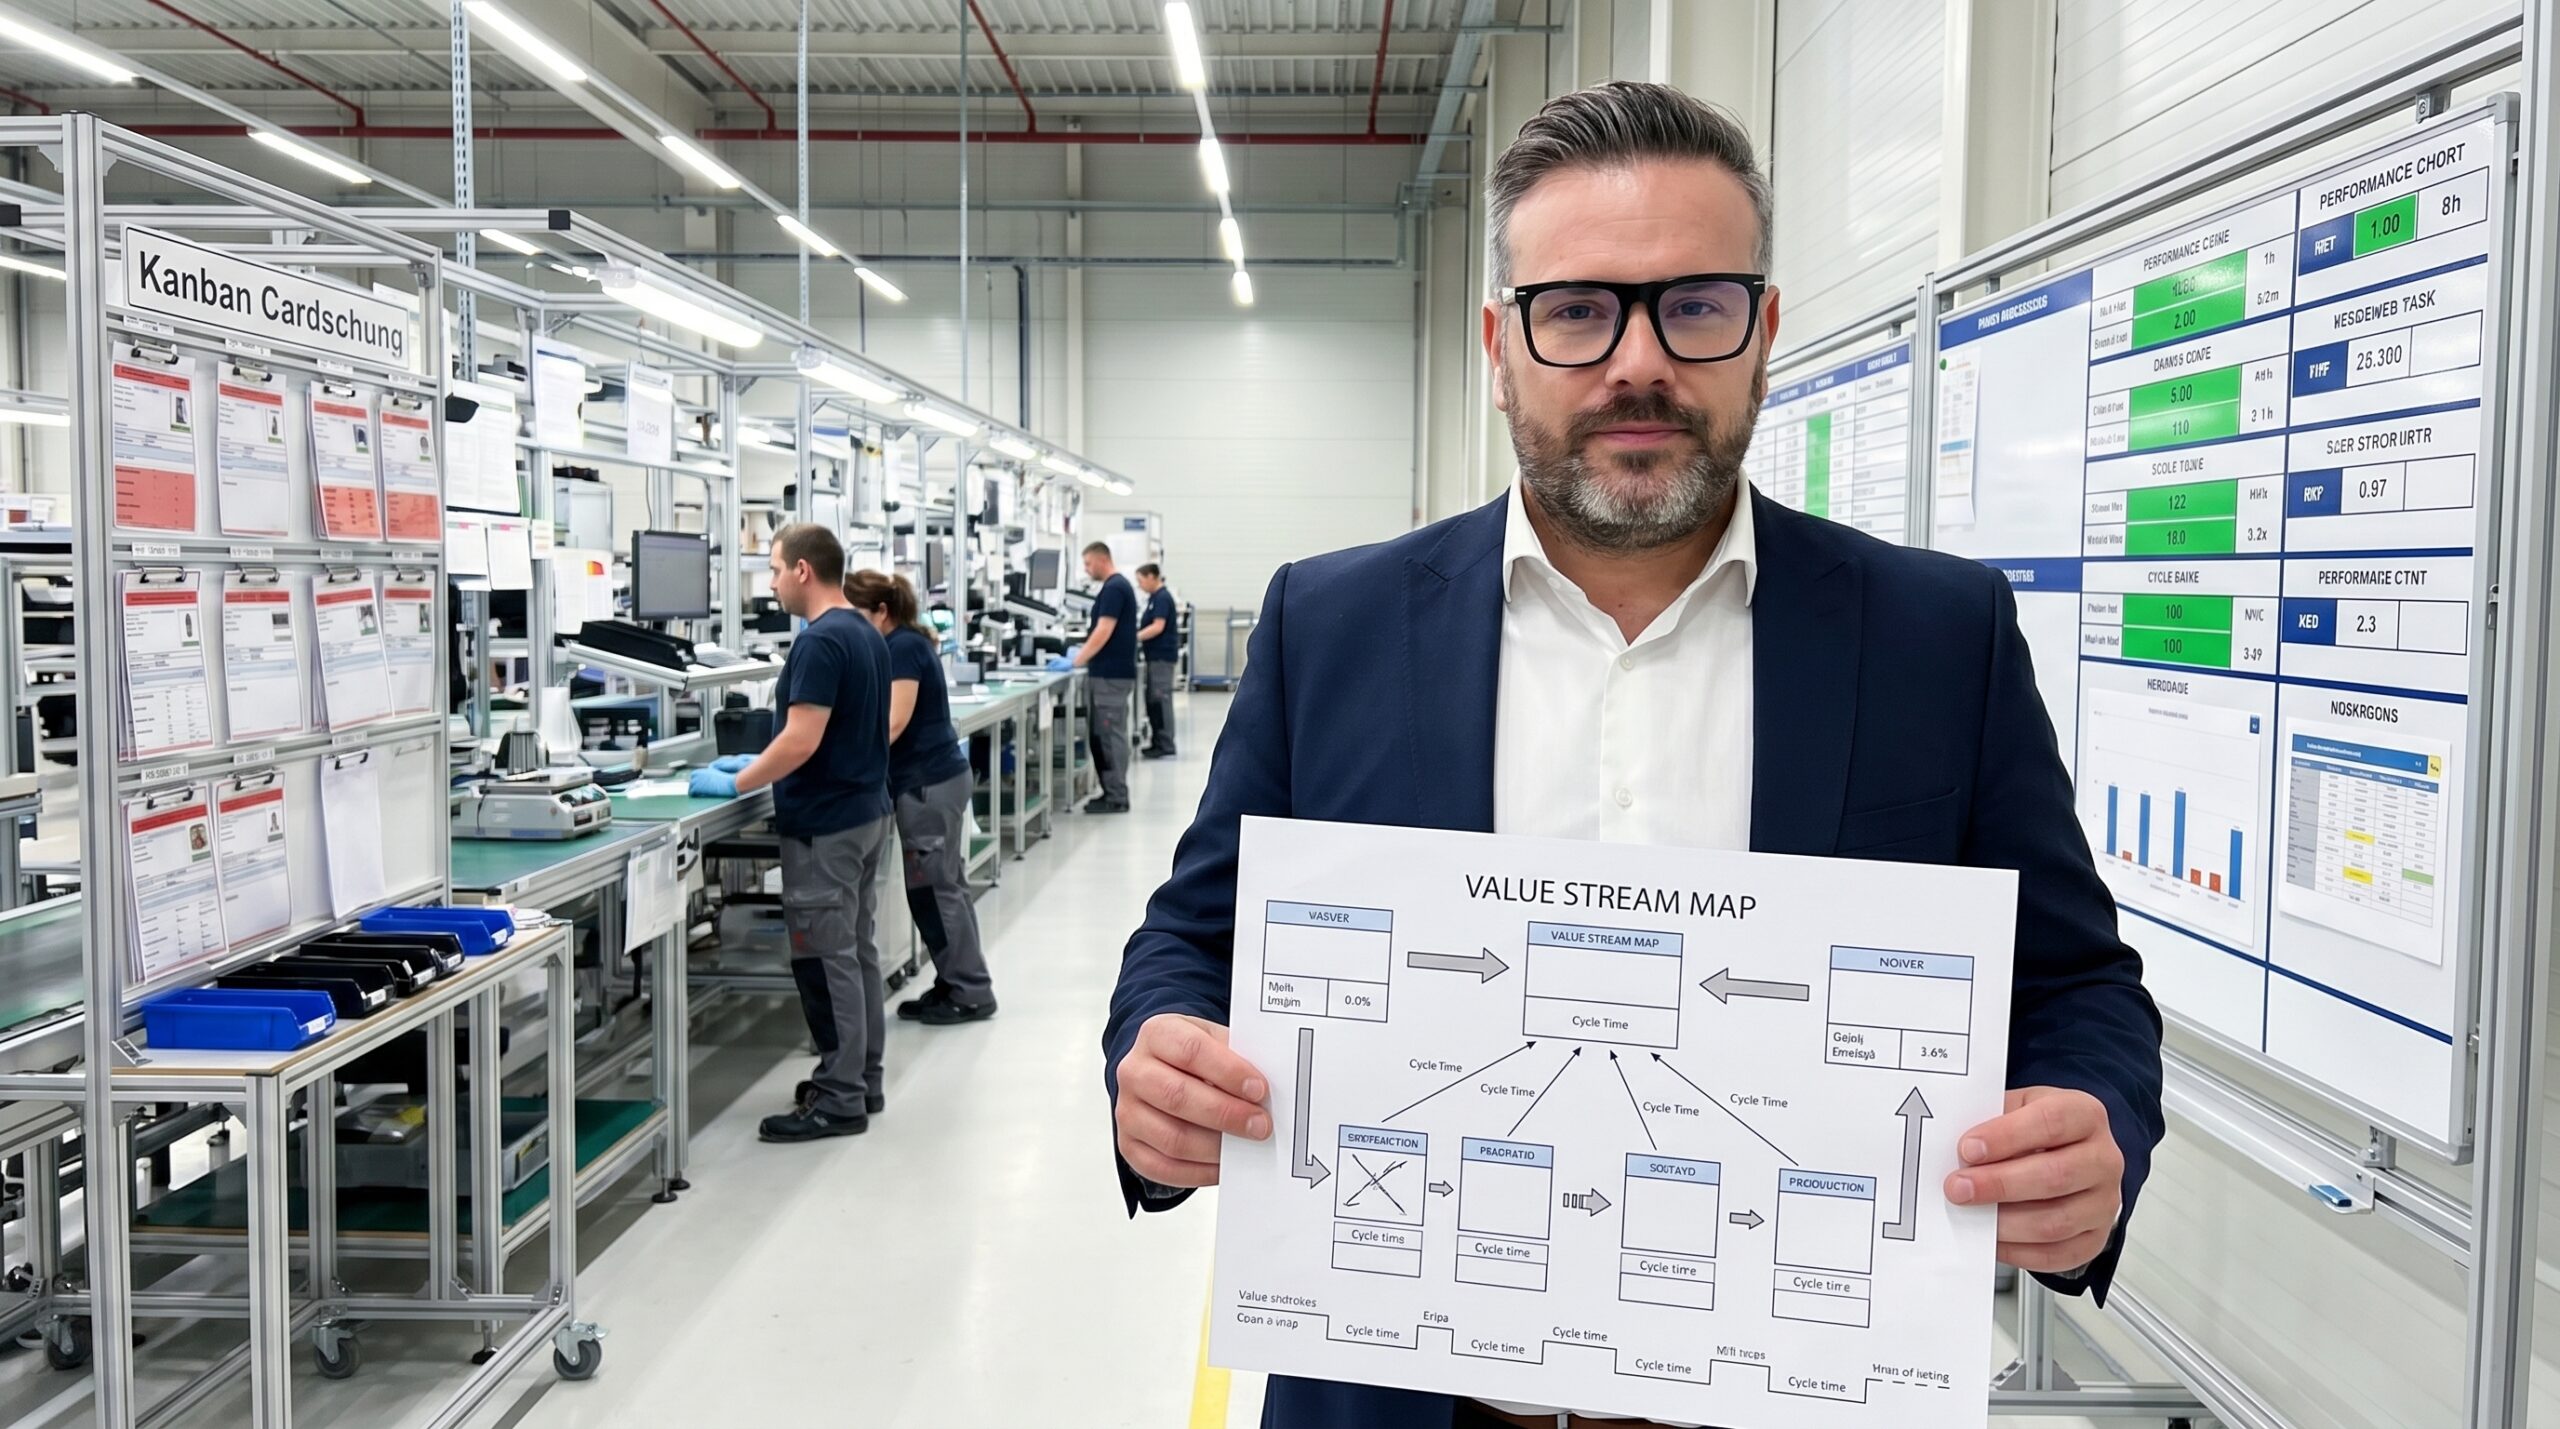
Most manufacturing plants do not know their actual process. They know their ERP output, their SOPs, and their standard times. But they cannot see the physical reality of material moving—or waiting—across the floor. I have audited plants where the system showed a 45-second cycle time, while the operator on the Gemba actually took 78 seconds because of an undocumented dimensional check.
Value Stream Mapping (VSM) is the mechanism that closes the gap between system perception and physical reality. Formalised by Mike Rother and John Shook in Learning to See, it is rooted in the Toyota Production System's material and information flow mapping. VSM captures the entire lifecycle of a product, from raw material supplier to customer delivery, laying bare the time spent waiting versus the time spent transforming.
The tool is blunt. When a cross-functional team maps a single product family and calculates the ratio of lead time to value-added time, the result is almost universally uncomfortable. In a precision automotive plant I recently supported, mapping revealed that out of a 23-day lead time, only 47 minutes were spent adding actual value. The remaining 96 percent was pure muda: waiting, moving, and batch staging.
Selecting the Scope and Walking the Gemba
The most common mistake beginners make is attempting to map an entire factory at once. This produces an unreadable web of lines that obscures rather than clarifies. You must restrict the initial scope to a single product family—a group of products passing through similar processing steps. A high-volume family or one with chronic delivery issues is the ideal starting point.
Mapping requires A1 paper, markers, and a physical presence on the shop floor. You cannot map from an office chair using standard operating procedures. Cycle times, changeover durations, and Work-In-Process (WIP) levels must be observed and timed in real-time. This is where the friction between documented procedures and actual practice surfaces.
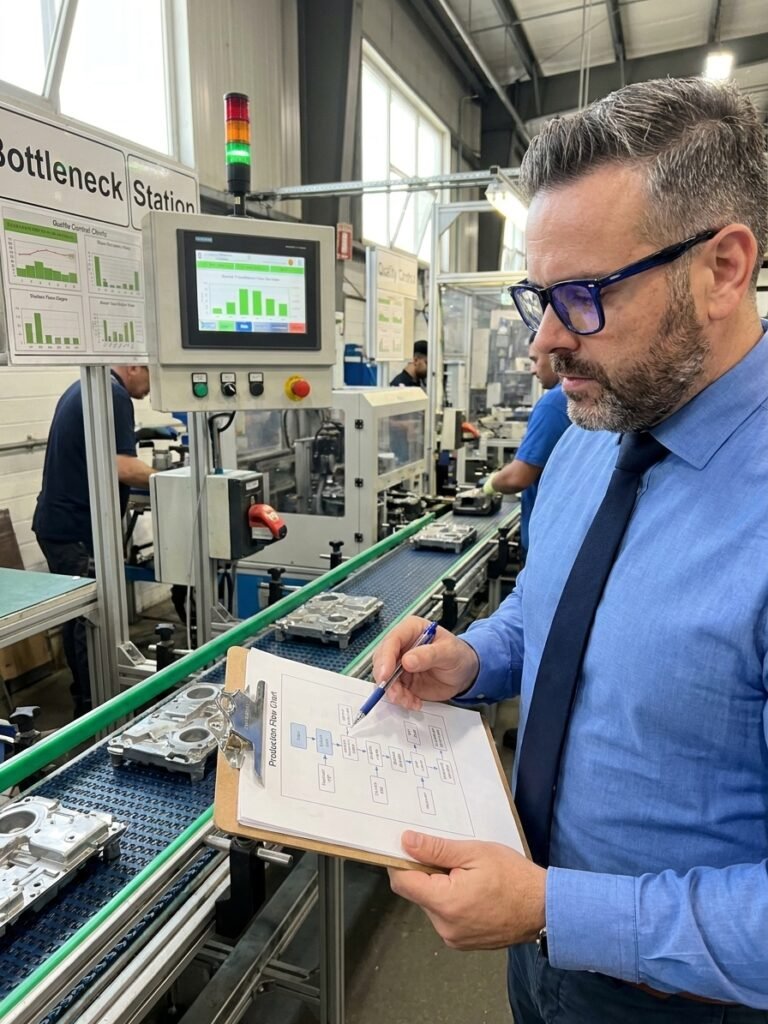
For each process step, you must record specific parameters: Cycle Time (C/T), Changeover Time (C/O), Uptime, batch size, and operator count. But the data that shifts perspectives is found at the end of the line. You calculate the total Lead Time (how long a unit takes to flow from raw material to dispatch) and compare it against the Processing Time (the sum of all C/Ts).
Exposing the Waste in the Current State
Once the current state map is drawn, the visual disparity between WIP inventory levels and actual cycle times becomes obvious. In the automotive plant example, the machining center had a cycle time of 94 seconds but held 5,800 pieces in WIP—equivalent to 9 days of buffer. The team had built a massive safety net because the 2-hour and 10-minute changeover time penalised small batches.
The map also exposes the information flow, which is frequently the root cause of material stagnation. In many plants, a reactive MRP system pushes production orders forward regardless of downstream consumption. When information flows independently of actual customer demand, every department overproduces to protect its own OEE metrics, artificially inflating lead times across the board.
| Process Step | Cycle Time | WIP before step |
|---|---|---|
| Cutting | 28s | 3,200 pcs (5 days) |
| Machining | 94s | 5,800 pcs (9 days) |
| Heat Treatment | 4h (batch 500) | 2,100 pcs (3 days) |
| Grinding | 62s | 4,400 pcs (7 days) |
| Inspection | 35s | 1,800 pcs (3 days) |
Designing the Future State Flow
The future state map is where you engineer the waste out of the system. The objective is not an ideal, perfect factory, but a realistic flow governed by customer demand. The primary driver here is Takt Time—the rhythm at which the customer consumes products. If demand is 2,250 units per shift with 7.5 hours available, the Takt Time is 12 seconds per piece. Every process step must be balanced to this cadence.
Where cycle times match, you establish continuous flow, eliminating WIP between stations entirely. Where processing times vary significantly—such as batch heat treatment versus discrete grinding—you implement a pull system using a Kanban supermarket. A predefined maximum inventory level caps overproduction, and downstream processes only withdraw what they immediately need.
To make this shift sustainable, you must designate a Pacemaker Process. This is the single point in the value stream where production is scheduled. Upstream from the pacemaker, material flows via FIFO; downstream, it pulls based on customer orders. Leveling (Heijunka) the production mix at the pacemaker prevents batches of a single variant from flooding the line, smoothing the demand on upstream suppliers.
Dismantling Bottlenecks with SMED
Large batch sizes are almost always a symptom of uncontrolled changeover times. In the mapped automotive facility, the machining center required 2 hours and 10 minutes to swap tooling. The natural reaction of the production team was to run massive batches, maximizing machine uptime while suffocating the rest of the value stream in WIP. Attacking this bottleneck required a targeted Single-Minute Exchange of Die (SMED) approach.
VSM without an action plan and implementation is just art. A map hanging on a wall changes nothing on the shop floor.
By separating internal changeover tasks (requiring the machine to stop) from external tasks (performed while the machine runs), the team systematically eliminated waste. Standardising clamping mechanisms and pre-staging tooling dropped the changeover time from 130 minutes to 38 minutes. Once the penalty for switching variants was minimised, the justification for large batches disappeared.
The mathematical impact on the value stream was immediate. Batch sizes at the cutting stage dropped from 3,200 units to 400. Lead time across the facility fell by 82 percent, landing at 4.2 days. Crucially, the value-added time remained 47 minutes—the ratio of waste to value simply shifted dramatically in favor of efficiency.
Impact of Future State Implementation
Executing the Transformation Plan
A future state map is a vision, not a result. Execution requires breaking the transition into structured phases. The initial 30 days should target quick wins: relocating inspection stations to enable continuous flow, enforcing visual management for WIP limits, and standardising existing changeover procedures. These actions build momentum without requiring heavy capital investment.
The subsequent phases demand deeper technical intervention. Days 30 through 90 require the formal SMED overhauls, the physical establishment of Kanban supermarkets, and the pilot testing of continuous flow cells. Beyond 90 days, the focus shifts to fully embedding pull systems, launching Heijunka leveling, and integrating digital tracking. Every phase requires named owners, firm deadlines, and measurable KPI targets.
The ultimate measure of success is cultural adoption. When I returned to the brake component facility a year after the initial mapping exercise, I found three new current-state maps drawn by the operators themselves. The team had internalised the methodology, using it to independently identify and eliminate new sources of waste. That is the point where a lean tool becomes a competitive advantage.
Integrating Digital Tools and Software
Traditional VSM relies on paper and pencil, and this remains the correct starting point for any initial mapping exercise. The manual effort forces the mapper to physically walk the Gemba and engage with the reality of the shop floor. However, software solutions like eVSM and iGrafx now allow teams to iterate rapidly, simulate future states, and share maps across global facilities.
Integrating Manufacturing Execution Systems (MES) and IoT sensors provides continuous, automated data collection for cycle times and uptime. This enables dynamic value stream tracking rather than relying on point-in-time manual studies. AI-driven analytics can further identify flow anomalies and bottleneck patterns that a human observer walking the line might miss.
Digitalisation, however, cannot replace fundamental understanding. Feeding bad data into a digital VSM platform simply generates a precise picture of a broken process. Teams must master the lean principles, the physical flow, and the calculation of Takt Time manually before layering software on top. The map is useless if the underlying process logic is flawed.