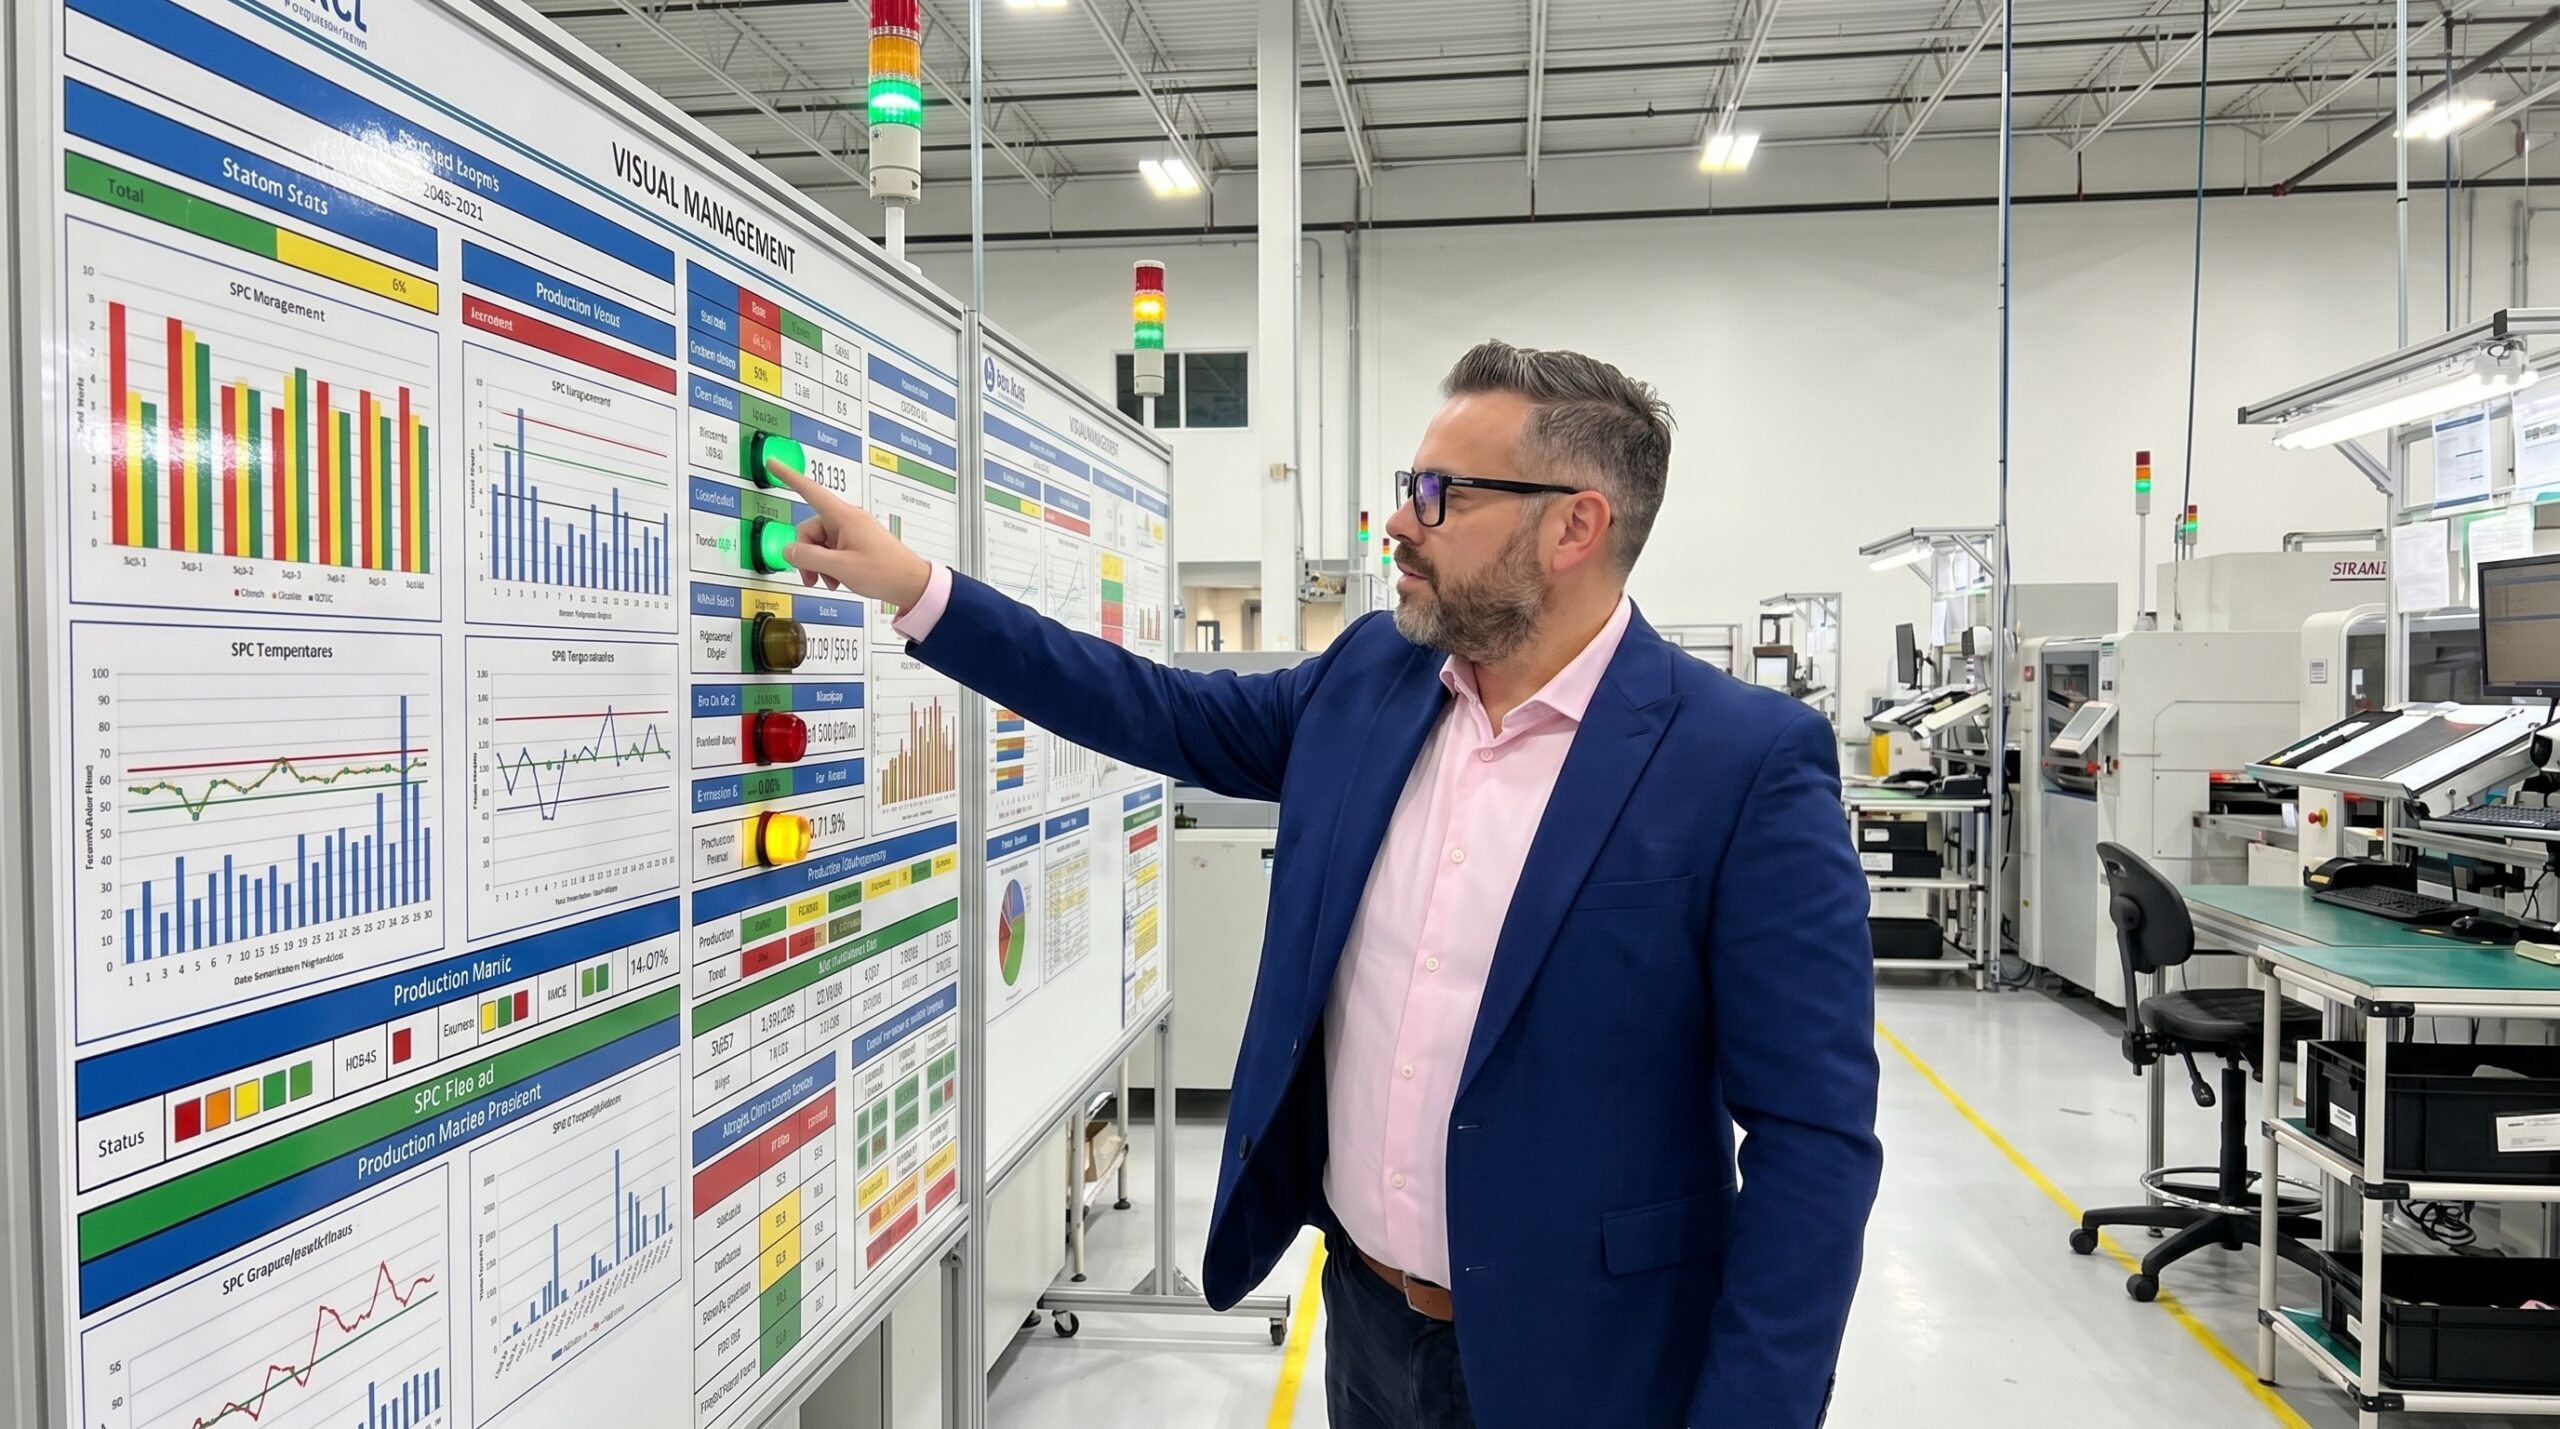
In most factories, critical process information is locked away. SPC charts sit on a supervisor's laptop. Reject rates are compiled in end-of-shift reports. Process deviations surface in email chains that never reach the operator running the machine. The people closest to the process are systematically the last to know when it drifts out of control.
An operator who cannot see the target cannot hit it. They do not know if the process is approaching a control limit, or if scrap rates are climbing. They discover the problem only when a dimension fails final inspection. By that point, the reaction is containment, not correction.
Visual management changes the flow of information. The principle is simple: if a parameter matters to quality or safety, it must be visible at the point of use. Status, problems, and adherence to standard must be immediately apparent without opening a file or asking a manager.
The Core Mechanics of Visual Management
Visual management is not decoration. It is a systematic approach to making process status instantly readable. The goal is to communicate complex data at a glance, reducing the time it takes a line operator to assess whether they should continue running or call for support.
The method relies on four practical principles. Information must be immediately visible, distinguishing an acceptable state from an unacceptable one using clear visual cues. It must be located exactly where the work happens. It must be simple, relying on colour coding and trends rather than dense data tables. Most critically, it must reflect current reality, not last week's performance.
I have audited plants where the entire shift's performance was managed from an Excel file updated once a day. The lag between a process shift and managerial awareness was measured in hours. Effective visual management compresses that lag to minutes by forcing the data out of the digital silo and onto the floor.
Building a Functional Quality Board
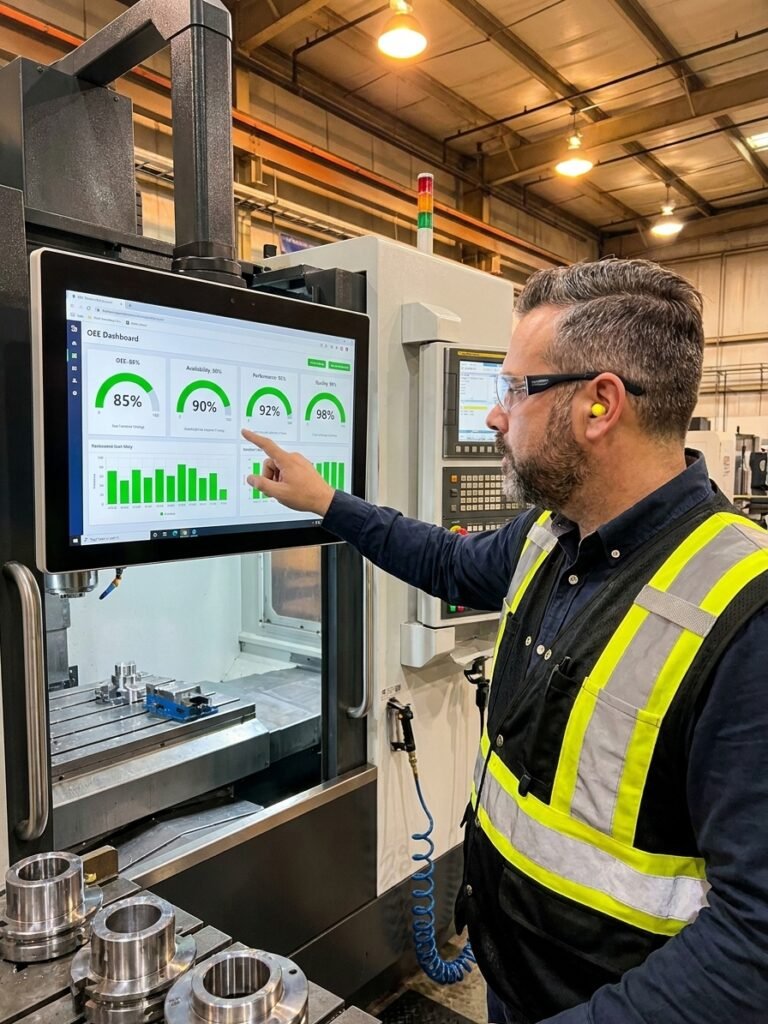
Every production line needs a dedicated quality board. This is a physical board located directly at the point of production, serving as the single source of truth for the shift. It converts IATF 16949 documentation requirements into a living, operational tool.
A functional board must display active SPC charts, allowing operators to see process drift before it breaches specification limits. It needs current reject rates plotted against daily targets. Crucially, it must list the top three ongoing quality issues with their assigned 8D or containment status, making escalation paths clear to everyone on the shift.
Layered Process Audit (LPA) findings must also live here. The board is the ideal place to track VDA 6.3 or customer-specific audit actions, ensuring that corrective measures are physically tied to the area where they apply. If an audit finding requires a process change, the board tracks it until the standard work is updated.
Visual Information Hierarchy on the Line
- 01ExtractPull critical metrics from ERP or QMS; discard non-actionable data.
- 02TranslateConvert numbers into visual status indicators: green, yellow, red.
- 03PositionPlace the information exactly where the operator makes the process decision.
- 04VerifySupervisors confirm the board is updated and accurate during floor walks.
Andon Systems and 5S Markings
Andon systems provide immediate status signalling. They use a strict colour logic to dictate operator action. Green means the process is running within specification and production continues. Yellow indicates the process is approaching a control limit and requires a preventative check or adjustment.
Red demands an immediate stop. A red signal means the process is out of specification or a safety threshold has been breached. When an andon triggers red, the standard work requires halting the line and calling for support. Continuing to run a red process deliberately violates standard work and guarantees nonconforming output.
Below the andon system, 5S floor markings and shadow boards provide the foundational layer of visual control. Shadow boards ensure operators immediately notice a missing torque wrench or gauge. Painted floor lines define safe walkways and material staging areas. When a tool is absent or a cart is outside its zone, the deviation is instantly visible without an audit.
The Kamishibai Board for Process Audits
The Kamishibai board, often used to manage Layered Process Audits, relies on a simple two-card system. Audit cards are displayed green-side up on the board. When an audit is completed, the card is flipped. If the audit identified a nonconformity, the red side is displayed.
This creates immediate visibility of audit compliance and process health. A supervisor walking the floor can instantly see which stations have been audited that day, which passed, and which require immediate containment actions. The system forces accountability without requiring a single spreadsheet to be opened or an email to be sent.
If a parameter matters to quality or safety, it must be visible at the point of use.
This physical visualisation is critical for sustaining LPA requirements under IATF 16949. It moves the audit from a documentation exercise into a daily operational habit. The board actively drives the behaviour, rather than passively recording it at the end of the month.
Shift Huddles and Status Tracking
Visual management requires a daily operational rhythm to function. The quality board and status charts form the agenda for the shift handover and start-up huddles. This is where the team reviews actual production counts against the planned schedule, assesses the previous hour's pass rate, and checks open safety concerns.
During the huddle, open quality issues must be assigned an owner and a deadline directly on the board. This forces the team to move from passive observation to active problem-solving. A documented issue with a name and a date attached becomes a commitment, preventing problems from lingering across multiple shifts without ownership.
The huddle must be short and focused entirely on the visual data presented. If the board shows a reject spike at hour two, the discussion addresses the root cause of that spike. If a Cpk drop is noted on the SPC chart, the team immediately assigns a technician to investigate the equipment variance.
Measuring the Impact of Visual Implementation
The transition from hidden data to line-level visual management produces measurable shifts in quality performance. Moving SPC charts from an office monitor to the machine, combined with a functional andon system, drastically reduces the time it takes to detect a process drift. Detection shifts from end-of-shift reaction to real-time correction.
Impact of Moving Quality Data to the Line
When operators can see the target and their current performance in real time, scrap rates fall. Reject rates drop significantly because the process is stopped at the yellow warning stage, not after producing a batch of nonconforming parts. The operation moves from reactive firefighting to in-process control.
Ultimately, if you cannot see it, you cannot manage it. Visual management makes the invisible visible and the visible actionable. By moving the data to where the work happens, you give the operator the tools they need to maintain the standard.