
A production line targets 480 units per shift. It delivers 380. The operations manager lists the constraints: staffed operators, running machines, available materials. None of it explains the shortfall. The real constraint is invisible.
In my experience auditing and correcting assembly lines, this gap is rarely a tooling failure. It is a line balancing failure. Work content is piled onto specific stations while others starve. The solution is not a software deployment. It is a manual time study and a Yamazumi chart.
A Yamazumi chart is a stacked bar graph derived from the Toyota Production System. Each bar represents one sequential operation in a production cycle. The height of the bar equals the actual cycle time. When you line these bars against the required takt time, the physical bottleneck becomes immediately obvious to everyone in the room.
Measuring Reality, Not Engineering Standards
The most common mistake teams make is building a Yamazumi chart from Standard Operating Procedure (SOP) times. SOPs describe what should happen. A Yamazumi chart must depict what actually happens on the floor.
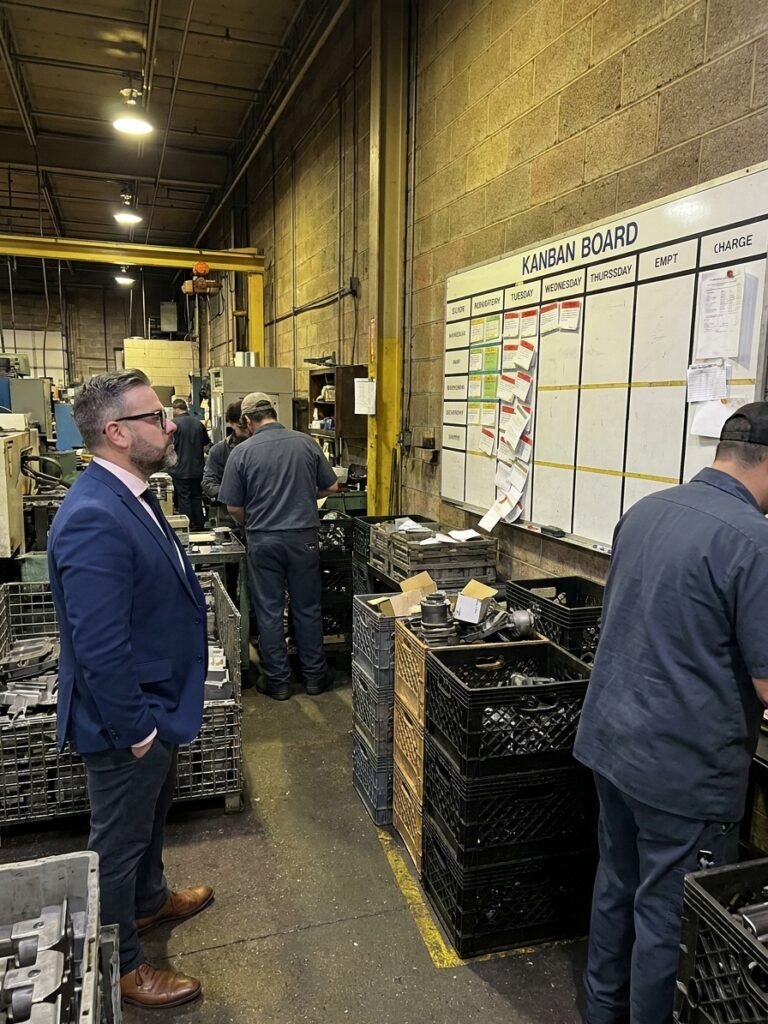
You must go to the Gemba with a stopwatch. Time each operation a minimum of twenty to thirty times. Capture the average, the minimum, and the maximum. High variability between min and max indicates a severe standardisation problem that will destabilise the line regardless of the average.
Segment each timed bar by work type. Green represents value-added work: the physical transformation of the product. Yellow represents necessary non-value-added work, such as walking or handling. Red represents pure waste: searching for parts, repositioning tools, or repairing defects.
Defining the Takt Time Constraint
Takt time is the heartbeat of customer demand. It dictates the maximum allowable cycle time for any single station. The formula is straightforward: available working time divided by required customer quantity.
A common error is calculating takt time using gross shift hours. You must deduct planned downtime: breaks, shift handovers, and planned preventative maintenance. If you have 440 minutes of actual available time and a demand for 480 units, your real takt time is 55 seconds, not 60.
Draw this takt time as a strict horizontal red line across your chart. Every bar exceeding this line is a bottleneck starving the downstream process. Every bar falling significantly below this line represents underutilised capacity and an opportunity to redistribute work.
Three Operational Strategies for Line Balancing
Once the chart exposes the imbalance, you have three primary strategies. The fastest and most cost-effective is work redistribution. If a bottleneck station runs at 73 seconds and a downstream station runs at 38 seconds, relocate a portion of the work.
Yamazumi Rebalancing Methodology
- 01Time StudyStopwatch 20-30 cycles per station at the Gemba to capture actual variation.
- 02Visualise DataStack the bars by value-added vs waste, then draw the strict takt time line.
- 03Redistribute WorkMove specific elements of cycle time from overloaded stations to underutilised ones.
- 04Eliminate WasteTarget the red segments using 5S and poka-yoke to remove non-value-added time.
- 05Execute KaizenInvest in process upgrades where bottlenecks persist despite full optimisation.
The second strategy targets the red waste segments. If an operator spends fifteen seconds searching for fasteners in a bulk bin, install a shadow board. This requires zero capital expenditure but immediately drops the cycle time.
The third strategy is Kaizen. If a station still exceeds takt time after waste elimination and work redistribution, you need a process change. Replacing a manual soldering operation with a semi-automatic fixture often cuts cycle time dramatically. Apply capital only after exhausting the first two strategies.
Variability and Hidden Walking Time
An average cycle time of 55 seconds against a 60-second takt looks safe on paper. But if the standard deviation is 8 seconds, that station will exceed 63 seconds roughly 16% of the time. Every time it does, the line stops. You must design for the maximum, or reduce the variation through standard work.
If you build a Yamazumi chart at your desk without operator input, you have a sketch, not an analysis.
Standard charts often ignore the time operators spend walking between stations, fetching materials, or moving rejected parts. This walking time can account for 10 to 15% of the total cycle. If you do not capture and map this movement, your balancing math will always be flawed.
Desk Analysis vs Gemba Reality
Engineering SOP Data
- Assumes perfect material presentation at the station
- Ignores natural operator fatigue and pace variation
- Excludes walking time for quality escalations
- Provides an ideal baseline that never exists in reality
Gemba Time Study
- Captures raw variation across a full shift profile
- Exposes hidden waste like searching and repositioning
- Quantifies unaccounted walking and handling delays
- Reveals the true constraint limiting system output
To solve this, build the chart with the operators. The people running the process know exactly why they have to search for tools or wait for parts. They will highlight the practical solutions that engineers miss.
Managing Multi-Variant Assembly
Real production lines rarely run a single product variant. Different configurations require different assembly times at the same stations. A single bar graph will mislead you. You need a multi-layered Yamazumi chart.
Assign a distinct colour to each product variant and stack them within the operational columns. This reveals which specific variant causes the most severe imbalances. It also ensures that balancing the line for Variant A does not inadvertently break the cycle time for Variant B.
Once you solve the balancing issue on one line, apply Yokoten. Standardise the learning and deploy the new balance standards across identical lines in the facility. Do not solve the same problem twice.
Integrating Digital Tools and Manual Observation
Modern Manufacturing Execution Systems (MES) can automatically generate Yamazumi charts from real-time machine data. This is valuable for tracking historical trends and spotting long-term drift. Digital dashboards make the data accessible and fast.
However, a software algorithm cannot tell you why an operator takes fifteen seconds to find a component. It only registers the delay. To understand the mechanics of the waste, you must stand at the station and watch the work.
The most effective quality systems combine both approaches. They use the MES data to identify the bottleneck quickly, and they take a physical flipchart to the Gemba to engineer the solution with the operators.
Contextualising Yamazumi within Lean Architecture
A Yamazumi chart is not an isolated tool. It fits directly into the standard Lean toolkit, providing the operational detail needed to execute broader strategic goals. It bridges the gap between high-level mapping and floor-level execution.
| Lean Tool | Scope | Primary Function |
|---|---|---|
| Yamazumi Chart | Single Line | Visualises operator load versus takt time across sequential stations. |
| Standard Work Combination | Single Station | Details the precise interaction of human time, machine time, and walking. |
| Time Observation Sheet | Data Collection | Captures the raw, unedited cycle data used to build the visual charts. |
| Value Stream Map | Entire Facility | Maps material and information flow to identify systemic process bottlenecks. |
When you pair the Yamazumi chart with a Standard Work Combination Table, you gain complete transparency. The combination table breaks down a single overloaded station into machine cycle time, operator manual time, and walking time.
This precise breakdown eliminates guesswork. You know exactly where to apply 5S, where to implement poka-yoke, and where to invest in Kaizen. The result is a stable line that meets customer demand without relying on operator stress or unplanned overtime.