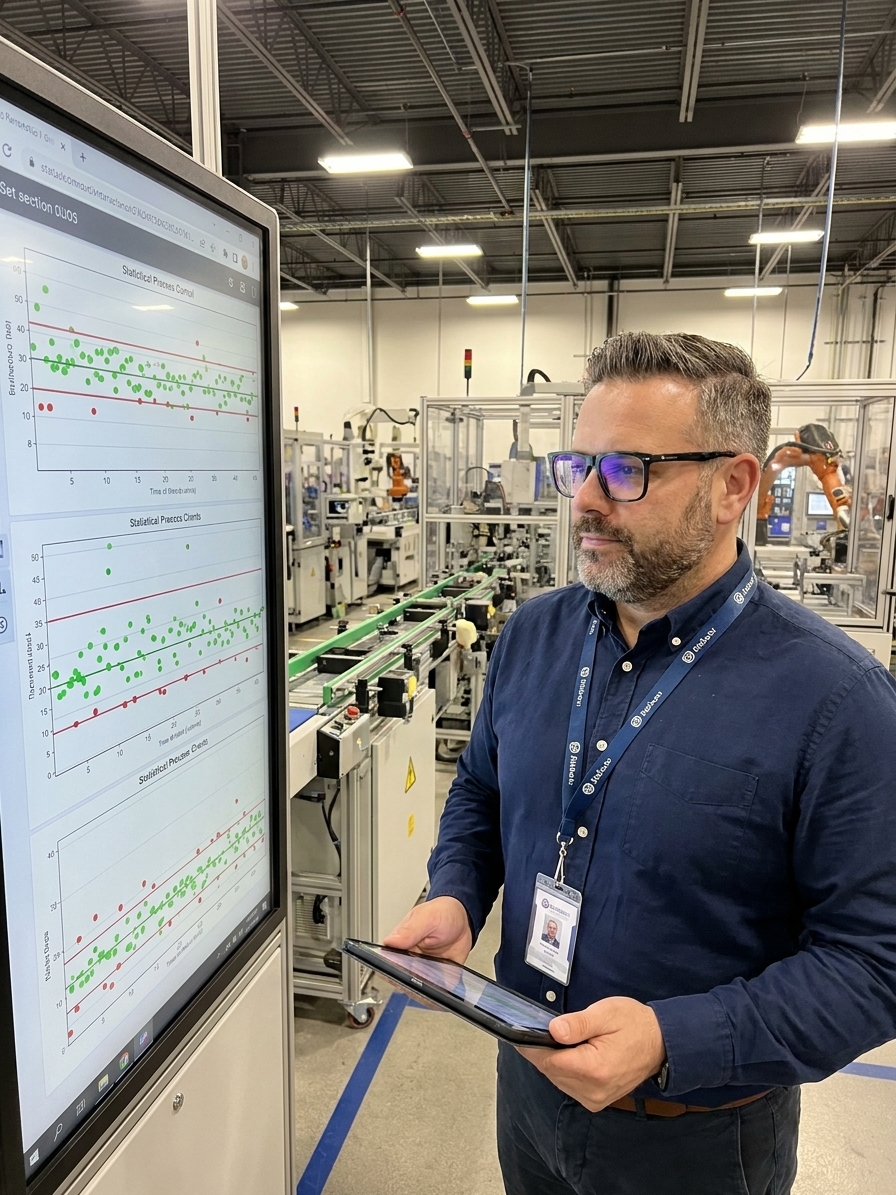
Walk into any manufacturing facility and you will find control charts. They hang on walls beside production lines, sit in quality binders, and populate automated dashboards. The operators glance at them on the way to break, and supervisors initial them during walkthroughs to prove compliance. The charts accumulate data diligently, documenting the precise history of the process.
What those charts rarely do is trigger action. I have audited plants where a gradual shift in the process mean was visible on the control chart for over a week. Nobody investigated the trend. The shift continued until a customer rejected an entire shipment, forcing a line stoppage and triggering a weeks-long corrective action effort. The data was available. The failure was organizational.
This is the reality of Statistical Process Control (SPC) in most organizations. They possess the data, generate the charts, and meet the audit requirements, but they fail to extract actionable intelligence. They have turned a process monitoring tool into wallpaper. Building a system that actually prevents defects requires understanding the mechanics of variation, establishing rigid response protocols, and connecting process capability directly to financial outcomes.
The Mechanics of Common Cause vs Special Cause Variation
Every manufacturing process varies, and SPC requires separating this variation into two distinct categories. Common cause variation is the natural background noise of your operation. It encompasses the small, random fluctuations inherent in the system: slight differences in raw material batches, minor ambient temperature swings, and normal tool wear. You cannot eliminate this noise without fundamentally re-engineering the process itself.
Special cause variation is an anomaly entering the system. A worn bearing past its service life, an untrained operator following outdated work instructions, or a blocked coolant line all constitute special causes. The process is no longer behaving predictably. The entire purpose of SPC is to mathematically distinguish between this unpredictable screaming and the predictable hum of common cause variation.
The critical failure mode in most organizations is treating all variation as special cause. Every data point that moves in the wrong direction triggers a machine adjustment. Every minor shift in the average prompts a parameter change. This behaviour, which Deming proved mathematically with his funnel experiment, constitutes tampering. Adjusting a stable process injects new variation into the system, guaranteeing worse output.
When operators react to common cause noise, they destabilize a predictable system. The correct response to common cause variation is to leave the process alone while planning a systematic improvement effort. The correct response to special cause variation is immediate investigation to identify and eliminate the anomaly. Confusing these two responses destroys process stability and exhausts your personnel.
Control Limits vs Specification Limits

The primary mechanism of SPC is the control chart, which plots process data over time against calculated boundaries. These boundaries are the upper control limit (UCL) and lower control limit (LCL). These limits are derived entirely from the process data itself, typically using 20 to 25 subgroups of stable production data. They define the mathematical boundaries of natural process variation.
Specification limits are entirely different. Specifications are dictated by customer requirements, engineering drawings, and functional tolerances. They define the boundaries of acceptable product. A frequent and catastrophic mistake is plotting process data against specification limits on a control chart. This does not provide statistical control; it simply provides a pass/fail visual check that fails to detect trends.
Control limits tell you what your process is actually doing. Specification limits tell you what the customer demands. The mathematical distance between these two sets of limits dictates your quality posture. If your process variation exactly fills the specification window, a single minor shift in the mean will generate defects. Understanding this gap is the foundation of reliable production.
The detection rules for out-of-control conditions rely on probability, not guesswork. A single point beyond a control limit, seven consecutive points on one side of the centreline, or six points steadily increasing are all statistically significant signals. These rules indicate the process has shifted. When a valid signal appears, the process has changed. Action is mandatory, not optional.
Process Capability and the Reality of Low Cpk
Once a process is stable and exhibiting only common cause variation, you can calculate its capability indices. Metrics like Cp and Cpk compare the natural spread of your process to the specification limits. They answer a fundamental question: can this process consistently produce conforming product? A Cpk of 1.33 indicates the process spread fits comfortably within tolerances.
A Cpk of 1.0 means the process barely fits within the specification limits. Any minor shift in the process mean will immediately result in nonconforming product. A Cpk below 1.0 means the process is actively generating defects even when it is running normally and predictably. The problem is not an operator error or a broken machine; the problem is that the system was never capable of meeting the tolerance.
I have walked into plants where the Cpk on critical dimensions was 0.8. To manage this inherent incapability, the plant operated a massive sorting operation at final inspection. They were paying manufacturing rates to produce defective parts, then paying inspection rates to find and scrap those parts. Sorting is not quality control. It is an admission of process failure and the most expensive possible management strategy.
The capability conversation is uncomfortable because it eliminates convenient scapegoats. Low capability is rarely the fault of the operators, inspectors, or suppliers. The problem lies in the core process design: the machine rigidity, the tooling geometry, the machining method, or the environmental controls. Fixing these foundational issues requires capital investment and management commitment, driven by the hard evidence SPC provides.
The Structural Failures That Undermine SPC
Organizations rarely fail at SPC due to a lack of software or statistical knowledge. They fail because they structurally misapply the tool. The most common error is attempting to monitor everything. Teams enthusiastically place control charts on every measurable dimension, flooding the dashboard with data. No supervisor can effectively monitor fifty active charts. The result is information overload and universal indifference.
Another critical failure is treating charts as historical records rather than active tools. When a chart is generated for a morning meeting, reviewed solely for compliance, and filed in a binder, it provides zero process control. Control charts must live at the point of use. If the operator running the machine cannot read the chart, understand the signal, and take immediate action, the system is purely administrative overhead.
Ignoring valid out-of-control signals destroys the integrity of the system. Organizations invest heavily in establishing baselines, only to ignore the signals when they appear because it is near the end of a shift or a supervisor wants to hit a production target. If operators learn that signals are occasionally disregarded, they will stop looking for them. The system collapses into theatre.
Many automotive suppliers implement SPC purely to satisfy IATF 16949 or specific customer requirements like those from major OEMs. The charts exist for the auditor. The data exists for the PPAP submission. Because the organization views SPC strictly as a compliance burden, they never realize the operational benefits. Reframing SPC as a cost-reduction tool requires demonstrating the financial impact of scrap prevention.
Designing a Disciplined SPC Architecture
Implementing an Active SPC System
- 01Identify Critical CharacteristicsUse PFMEA and historical defect data to select the parameters that directly impact safety, function, or regulatory compliance.
- 02Establish the BaselineCollect 20 to 25 subgroups of data from a stable process. Calculate UCL and LCL mathematically from this baseline.
- 03Deploy at the Point of UsePlace the control chart with the operator. Train the operator on detection rules and the exact response protocol for signals.
- 04Define the Response LoopDocument who gets notified, the required investigation steps, and the criteria for stopping the line versus adjusting the process.
- 05Connect to CapabilityUse the stable SPC data to calculate Cpk. Prioritize low-capability processes for targeted improvement and capital investment.
Building a functional system requires ruthless prioritization. Use your PFMEA to select only the most vital characteristics for active monitoring. Ten parameters monitored rigorously by engaged operators will always outperform a hundred parameters monitored passively by a disconnected quality department. Master the fundamentals on critical dimensions before expanding the scope.
Establish proper baselines by documenting the exact conditions under which the data was collected. Record the machine, the tooling revision, the raw material lot, and the operator training level. Recalculate the control limits only when a fundamental, documented change has occurred, such as the installation of new equipment or a validated process improvement. Never adjust limits arbitrarily.
Training must transcend plotting points on a graph. Operators need practical instruction on the difference between common and special cause variation. They must understand exactly why adjusting a stable process causes harm. Most importantly, they must know the precise response protocol when a signal triggers. If the protocol is not documented and enforced, the system will degrade into ad-hoc reactions.
Finally, connect the monitoring system to your improvement engine. Use SPC data to measure the success of process changes. If an engineering change is implemented to improve capability, the SPC chart will prove whether the variation actually decreased. This closes the loop between monitoring and improvement, transforming SPC from a defensive inspection tool into an offensive competitive advantage.
The Management Shift From Reaction to Prediction
The mathematics of SPC are well-established, but the implementation is a profound cultural challenge. It requires management to accept that action without understanding causes harm. When a manager sees a metric trending downward, the instinctive response is to demand an immediate fix. If that trend is common cause variation, the demand for action will actively degrade the output.
The data does not care about your urgency. Variation follows its own rules, and you either learn to speak its language or fight a losing battle.
Managers must learn to read a control chart and distinguish between stability and capability. A process may be perfectly stable, meaning it is predictably producing scrap. The correct managerial response to a stable but incapable process is not to yell at the operator. The correct response is to authorize a structured improvement project targeting the specific machine or method limiting capability.
As organizational maturity increases, SPC transitions from a detection mechanism to a predictive tool. Process capability trends are tracked longitudinally. Data feeds into broader quality intelligence systems, allowing engineering teams to predict tooling failure before it triggers a defect. At this stage, SPC directly informs strategic decisions regarding capital allocation, supplier selection, and new product design.
Organizational SPC Maturity
- Stage 1: ComplianceCharts exist solely for IATF 16949 or customer audits. Data is filed and ignored. SPC operates purely as a cost centre.
- Stage 2: DetectionSignals are occasionally caught and investigated. SPC prevents some major defects but relies heavily on final inspection.
- Stage 3: PreventionOperators act on signals immediately. Processes remain stable. Cpk drives improvement priorities, yielding measurable scrap reduction.
- Stage 4: OptimizationSPC data integrates into predictive models and strategic planning, guiding capital investment and product design decisions.
Most organizations I evaluate are firmly stuck oscillating between Stage 1 and Stage 2 on this maturity curve. They generate charts out of compliance obligation, occasionally catching a glaring error. Moving to Stage 3 requires strict discipline. It mandates that every out-of-control signal triggers a documented, immediate response without exception.
The transition to Stage 3 and Stage 4 is fundamentally a leadership challenge. Quality managers must demonstrate the financial return of SPC to secure the necessary investment in operator training and engineering resources. When leadership sees a documented reduction in scrap costs directly correlated to SPC interventions, the system transitions from a mandated burden to a core business strategy.