The Number Nobody Wants to
Hear
Every quality professional knows the speech. You stand before
leadership, slide deck loaded with charts, and deliver the verdict: “The
cost of poor quality is consuming X percent of our revenue.” You pause
for effect. Leaders shift uncomfortably. Someone asks for the breakdown.
You show them the categories — internal failure, external failure,
appraisal, prevention — and the numbers behind each. Heads nod. Concern
registers on faces. A task force is commissioned. And six months later,
the cost of poor quality is exactly the same, except now you also have
the cost of the task force.
The Cost of Quality model was supposed to be a wake-up call. Philip
Crosby told us that “quality is free,” that the cost of doing things
wrong far exceeds the cost of doing them right. The math is undeniable.
Every scrapped part, every rework cycle, every warranty claim, every
customer complaint investigation, every line shutdown — these are real
dollars leaking from the business. The Cost of Quality framework gave us
a language to talk about waste in terms executives understand:
money.
But somewhere between Crosby’s insight and your quarterly quality
cost review, the tool transformed. The measurement became the
deliverable. The report became the ritual. The cost categories became
permanent budget lines. And the organization settled into a comfortable
relationship with its quality costs — not comfortable enough to
celebrate them, but comfortable enough to stop doing anything about
them.
This is the story of how a framework designed to eliminate the cost
of poor quality became the framework that normalized it.
The Four Categories
That Became Four Silos
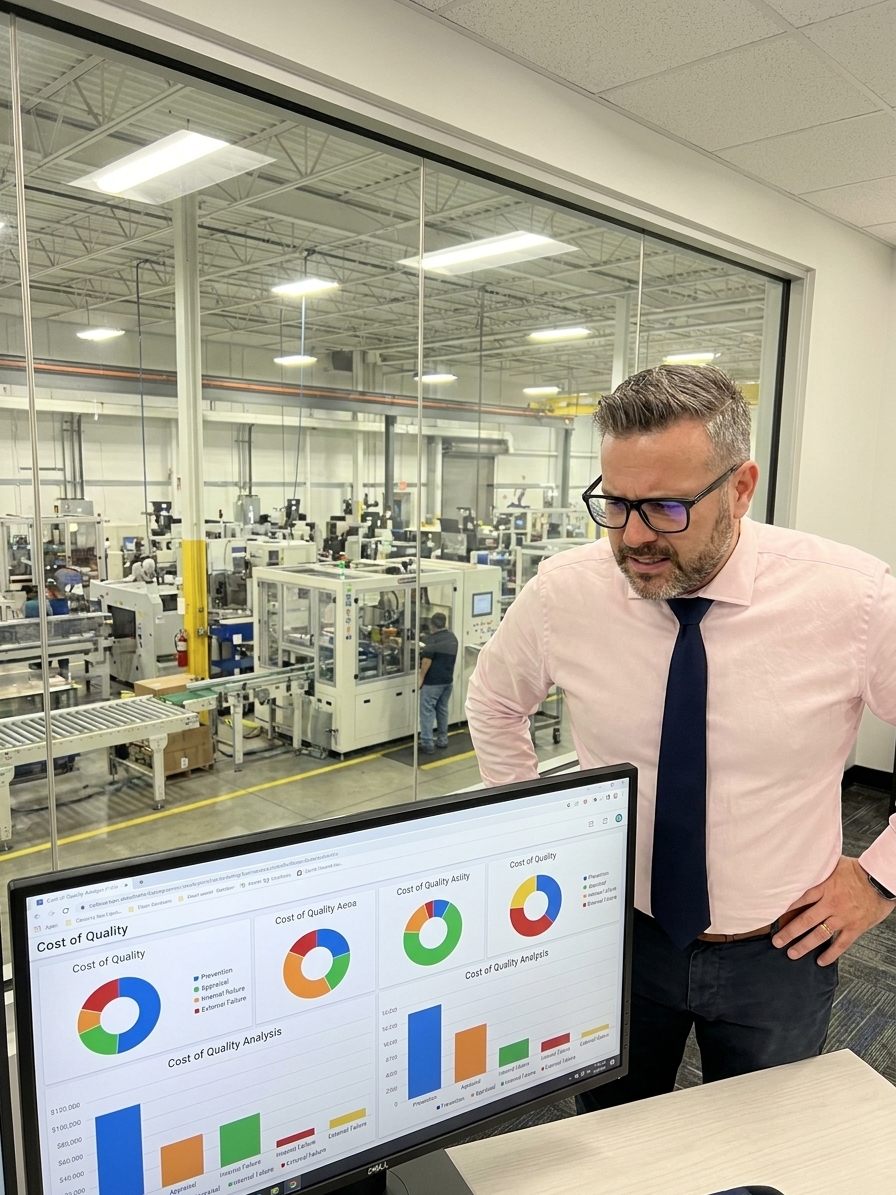
The Cost of Quality model divides quality-related spending into four
buckets: Prevention (training, planning, process design), Appraisal
(inspection, testing, audits), Internal Failure (scrap, rework,
downtime), and External Failure (warranty, recalls, lost business). The
theory is elegant: invest in Prevention, reduce the need for Appraisal,
and watch both Internal and External Failure costs plummet. The total
cost of quality drops as you shift spending leftward — from failure to
prevention.
It’s a beautiful theory. Here’s what actually happens.
Prevention: The
Category Everyone Funds Last
Prevention is the category that requires investment now to save money
later. It’s the training program, the process redesign, the supplier
development initiative, the design-for-manufacturing review. In theory,
every executive agrees this is where quality dollars should go. In
practice, prevention is the first budget line cut when the quarter gets
tight.
Why? Because prevention spending is invisible when it works. A
well-designed process that prevents defects produces no dramatic success
story. There’s no fire to put out, no crisis to avert, no hero to
celebrate. The training that prevented a thousand defects cannot show
you the thousand defects that didn’t happen. And so the prevention
budget is treated as discretionary — nice to have when times are good,
expendable when the numbers need help.
Meanwhile, the failure costs — which are ten to a hundred times
larger — are treated as fixed. Scrap, rework, warranty claims, expedited
shipping to replace defective product — these hit the budget as
unavoidable costs of doing business. Nobody questions them because
questioning them would mean admitting that something fundamental about
the operation is broken. It’s easier to fund the fire department than to
mandate fire-resistant construction.
The result: your Prevention category stays small while your Failure
categories stay enormous, and your annual Cost of Quality report shows
the same inverted investment year after year. You’ve stopped being
surprised by the numbers. That’s the first sign the framework has
stopped working.
Appraisal: The Inspection
Empire
If Prevention is the category everyone underfunds, Appraisal is the
category everyone overbuilds. Inspection, testing, and audit programs
grow with a logic all their own. Each defect escape triggers a new
inspection step. Each customer complaint adds another check. Each audit
finding creates a new verification requirement. The inspection apparatus
expands because adding a check feels like taking action, even when the
check adds no value.
Here’s how the appraisal empire grows: A defective batch reaches the
customer. The corrective action? Add an end-of-line inspection. Another
defect slips through the end-of-line inspection. The response? Add an
in-process inspection upstream. The in-process inspection catches some
defects but misses others. Add a second inspector. Then a third shift of
inspectors. Then an audit of the inspectors.
At no point does anyone ask the foundational question: why are we
producing defects in the first place? The inspection empire exists
because the process is broken, but fixing the process requires
investment in Prevention, and Prevention is the discretionary budget. So
instead of fixing the process, you build a parallel quality organization
whose entire purpose is to catch the output of a broken process. And you
call this quality management.
The Cost of Quality report shows your Appraisal costs rising every
year. You interpret this as increased quality commitment. In reality,
it’s evidence of process deterioration. More inspection means more
defects being generated upstream. The bigger your inspection budget, the
worse your process has become. But the framework doesn’t tell you that —
it just reports the number, and you file it with all the other numbers
you’ve learned to live with.
Internal Failure:
The Scrap Pile Nobody Owns
Internal failure costs — scrap, rework, downtime, line stoppages —
are the most visible quality costs and somehow the least addressed. This
seems paradoxical until you understand the organizational dynamics at
play.
Scrap happens on the shop floor. The operator sees it. The supervisor
logs it. The quality engineer investigates it. A report is written. A
corrective action is opened. And then the scrap continues, because the
root cause — a machine that’s past its maintenance window, a supplier
whose material is marginally out of spec, a process that was never
properly validated — is too expensive or too politically sensitive to
fix.
So the organization adapts. The scrap rate becomes a known number, a
line item in the cost of quality report. It gets budgeted. Variance
analysis is performed. If the scrap rate stays within the expected
range, nobody panics. If it spikes, there’s a flurry of activity —
another task force, another investigation, another report — until the
rate settles back to its “normal” level of waste.
The problem is that “normal” is whatever the organization has decided
to tolerate. Five percent scrap becomes the baseline. Then six percent,
because the machine is getting older. Then seven percent, because the
supplier changed their material formulation. Each increment is
explained, justified, absorbed. The cost of quality report documents the
trend, and the trend becomes the new normal.
This is how internal failure costs become invisible in plain sight.
They’re reported, measured, categorized, and completely inert. The
measurement system is working perfectly. The improvement system is
completely broken.
External
Failure: The Cost That Should Terrify You
External failure costs — warranty claims, field recalls, customer
returns, lost business, brand damage — are the category that should keep
executives awake at night. These are the costs that multiply
exponentially: a single field failure can cost a hundred times more than
catching the defect internally. A recall can cost a thousand times more.
Lost customer trust is essentially priceless.
Yet external failure costs are routinely underestimated in Cost of
Quality reports. Why? Because the reporting system captures the direct
costs — the warranty payment, the replacement shipment, the legal
settlement — but misses the indirect costs. The customer who quietly
takes their business elsewhere doesn’t generate a cost line. The
prospect who heard about the recall and chose a competitor doesn’t
appear in the report. The engineering team that spends three months
managing a field failure instead of developing new products — their
salaries are allocated to R&D, not to the cost of poor quality.
The true cost of external failure is always larger than the reported
cost. Sometimes dramatically larger. But the Cost of Quality framework,
as implemented in most organizations, systematically understates this
category. And since the reported number looks manageable, leadership
doesn’t feel the urgency that the real number would demand.
This creates a dangerous feedback loop. External failure costs appear
low → leadership doesn’t prioritize prevention → prevention investment
remains inadequate → defects continue to reach the customer → actual
external failure costs mount but remain unreported → the reported
numbers still look fine. The organization is bleeding, but the bandage
looks clean.
The Optimization Paradox
Here’s where the Cost of Quality framework twists into its most
insidious form. Some organizations do attempt to act on the data. They
launch cost-of-quality reduction initiatives. They set targets: “Reduce
quality costs by 15 percent this year.” And then the optimization
begins.
The first thing optimized is Appraisal, because it’s the easiest to
cut. Reduce inspection points. Eliminate redundant tests. Narrow the
audit scope. The Appraisal budget drops, and the total Cost of Quality
number improves. Leadership celebrates.
But the defects that the inspections were catching don’t disappear.
They simply move downstream — from Internal Failure (caught early, cheap
to fix) to External Failure (caught by the customer, expensive to fix).
The Cost of Quality report shows improvement for one or two quarters,
then deteriorates sharply as warranty claims and customer complaints
rise.
The response? The organization adds back the inspection steps it cut,
plus a few more for good measure. The Appraisal budget returns to its
previous level — or higher. And the Cost of Quality report reflects the
same numbers as before, except now there’s also the cost of the
optimization initiative, the cost of the temporary quality decline, and
the cost of the customer relationships damaged during the
experiment.
This is the optimization paradox: attempting to reduce the Cost of
Quality by cutting measured costs often increases the actual cost of
quality by shifting defects into unmeasured channels. The framework
measures what it can see, and what it can see is not the whole
picture.
The True Cost of
Cost-of-Quality Reporting
Let’s talk about the cost of the Cost of Quality system itself.
Because there is one, and it’s rarely counted.
Maintaining a Cost of Quality reporting system requires data
collection from every department, cost allocation across categories,
regular reconciliation, report generation, review meetings, and
presentation preparation. In a mid-size manufacturing operation, this
consumes hundreds of person-hours per quarter. The quality finance
analyst who maintains the cost model. The quality manager who reviews
the numbers. The plant manager who attends the review. The director who
presents to the executive team. The executive team that sits through the
presentation.
All of these hours have a cost. And that cost is never included in
the Cost of Quality report itself, because the cost of the reporting
system is classified as administrative overhead, not as a quality cost.
The framework that was designed to expose hidden costs has hidden costs
of its own, and it doesn’t account for them.
In some organizations, the Cost of Quality reporting system consumes
more resources than any single quality improvement initiative. The
organization spends more time measuring quality costs than it spends
reducing them. The report has become the product. The measurement has
become the goal.
This is the ultimate failure mode of the Cost of Quality framework:
it transforms a diagnostic tool into a permanent administrative
function. The organization builds an apparatus to measure a problem, and
the apparatus becomes so entrenched that solving the problem would mean
dismantling the apparatus — and nobody wants to dismantle something
they’ve invested years in building.
The Vendor Opportunity
Nobody Exploits
There’s one more dimension to the Cost of Quality failure that most
organizations miss entirely: the supply chain. Your Cost of Quality
report captures your internal costs, but what about the costs your
suppliers pass on to you?
The supplier whose material is marginally within spec but causes
excessive tool wear on your equipment — that cost shows up as Internal
Failure, but it’s caused by an external entity. The supplier whose
process capability is declining, forcing you to increase incoming
inspection — that cost shows up as Appraisal, but the root cause is
upstream. The supplier who delivers late, forcing expedited shipping and
line schedule disruptions — those costs ripple through your operation
disguised as logistics expenses.
Most Cost of Quality systems stop at the factory door. They measure
what happens inside the four walls and ignore the quality costs imported
through the supply chain. This means the reported Cost of Quality is, at
best, a partial picture. In operations where supplier-driven quality
issues are significant — and in most manufacturing operations, they are
— the true Cost of Quality is substantially higher than what the report
shows.
But addressing supplier quality costs requires something most
organizations aren’t willing to do: treating suppliers as extensions of
the internal process rather than as external vendors. That means
investing in supplier development, sharing quality data, collaborating
on process improvement, and building long-term partnerships instead of
chasing the lowest unit price. It means spending Prevention dollars
outside the organization, where the ROI is harder to measure and the
budget owners have less control.
So the supplier dimension remains unaddressed, the imported quality
costs keep flowing, and the Cost of Quality report continues to document
only the portion of the problem that lives inside the building.
Breaking the Cycle
If your Cost of Quality reporting system has become a ritual rather
than a catalyst, you’re not alone. The pattern is industry-wide. But
recognizing the pattern is the first step to breaking it. Here’s what
actually works:
Stop reporting, start acting. The Cost of Quality
report has already told you everything it’s going to tell you. You know
where the failure costs are concentrated. You know which prevention
investments are underfunded. Another quarter of the same data won’t
generate new insights. Take the top three failure cost categories and
launch improvement initiatives targeting root causes — not more
reports.
Shift the conversation from cost to investment. The
Cost of Quality framework frames quality spending as a cost to be
minimized. Reframe it: prevention spending is an investment with a
measurable return. The ROI on process improvement, training, and
design-for-quality is typically five to twenty times the investment.
Present it that way to leadership, and the budget conversation changes
fundamentally.
Measure what matters, not what’s easy. The
four-category model is a simplification. Your real quality costs are
concentrated in a handful of specific processes, materials, and failure
modes. Find those — not through an enterprise-wide cost allocation
exercise, but through targeted analysis of where defects are actually
generated and where they actually cost the most.
Include the supply chain. Your suppliers’ quality
problems are your quality costs. Bring them into the prevention
investment. Share the data. Build the capability. Stop paying for their
poor quality through your failure costs.
Kill the annual report. Or at least stop treating it
as the primary output of your quality organization. The energy that goes
into maintaining the Cost of Quality reporting system would, redirected
to actual process improvement, reduce the quality costs by more than the
reporting system could ever measure.
The Bottom Line
Philip Crosby was right: quality is free. The cost of poor quality
dwarfs the cost of prevention. The math hasn’t changed in fifty years.
What has changed is that organizations have built elaborate systems to
measure the cost of poor quality while systematically underinvesting in
the prevention that would eliminate it.
Your Cost of Quality report is not your quality system. It’s a mirror
— and a mirror that’s been hanging on the wall so long that everyone has
stopped looking at it. The reflection hasn’t changed. The waste is still
there. The opportunities are still there. The only question is whether
you’ll keep polishing the mirror or finally turn around and fix what
it’s been showing you.
The cost of quality isn’t a number on a report. It’s a choice your
organization makes every day — to measure the problem or to solve it.
And the most expensive choice of all is the one where you believe that
measuring is solving.
About the Author: Peter Stasko is a Quality
Architect with over 25 years of experience transforming manufacturing
operations across automotive, electronics, and industrial sectors. He
has implemented quality management systems on three continents and has
spent decades watching organizations build elaborate frameworks to
measure problems they could have solved with a fraction of the effort.
He writes about the gap between quality theory and manufacturing
reality.