Quality
and the Law of Diminishing Returns: When Your Organization’s Pursuit of
Perfection Becomes the Pursuit of Irrelevance
The Inspection Line
That Ate the Company
There’s a manufacturing plant in central Europe — I won’t name it,
but you’d recognize the brand — that once employed 340 inspectors for a
production line of 200 operators. Three hundred and forty people whose
sole job was to find defects that 200 people were creating. The math
should have told them everything. It didn’t.
The plant manager, a meticulous engineer who genuinely believed in
zero defect, had built an inspection empire. First came incoming
inspection. Then in-process inspection. Then final inspection. Then a
second pass of final inspection because the first pass wasn’t catching
everything. Then statistical sampling on top of the inspections. Then an
audit team to audit the inspection teams. By the time I walked through
those doors as a consultant, the cost of detecting a single defect had
exceeded the cost of the product itself.
The defect rate? 1.2 percent. Down from 4.3 percent three years
earlier. Impressive, until you looked at what it cost to get there.
Here’s what nobody in that plant wanted to hear: the journey from 4.3
percent to 2.1 percent had cost roughly €180,000 and taken eight months.
The journey from 2.1 percent to 1.2 percent had cost €1.4 million and
taken two years. The next reduction — from 1.2 percent to 0.8 percent —
was projected to cost €3.2 million and take another three years.
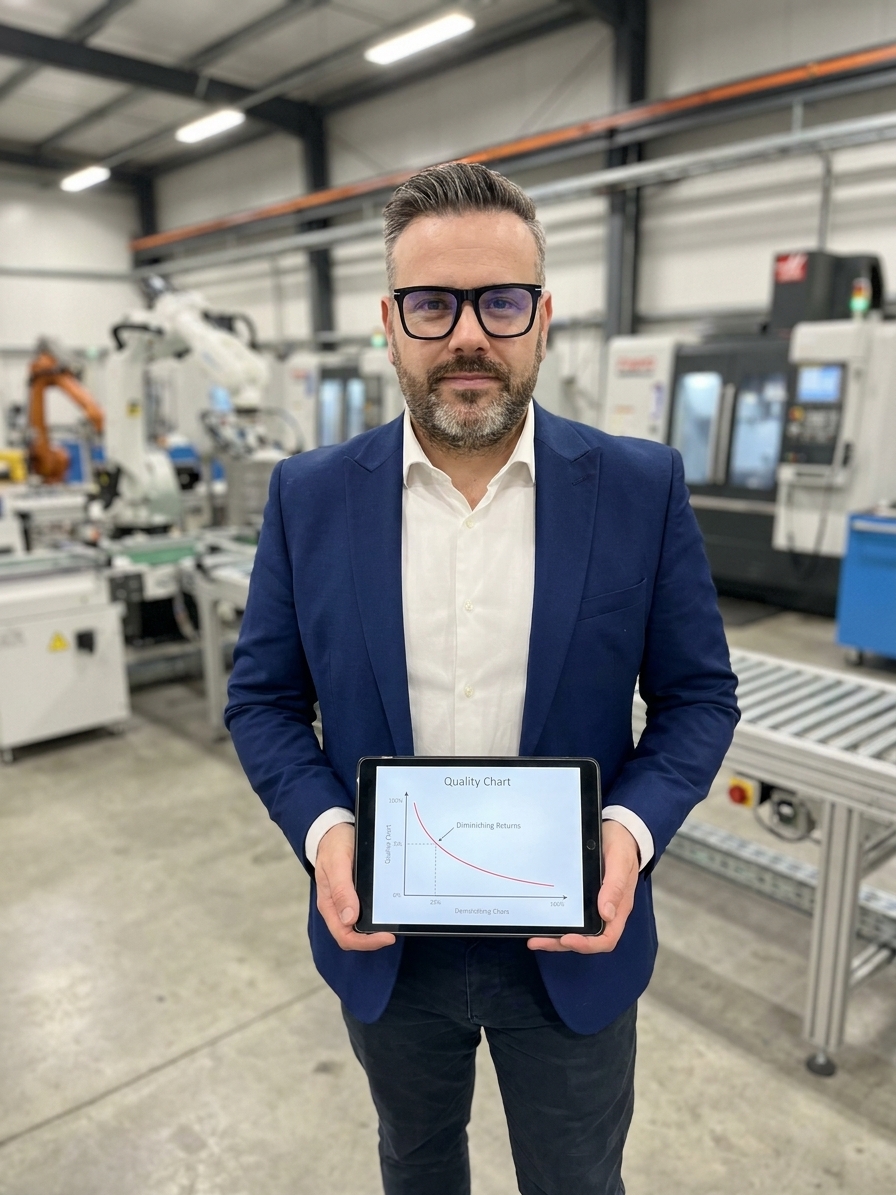
That’s the law of diminishing returns in quality, and it will eat
your organization alive if you don’t understand it.
What the Law Actually Says
The law of diminishing returns is one of the most intuitively
understood yet systematically ignored principles in manufacturing. At
its core, it states that as you increase investment in any single
variable while holding others constant, the incremental gains from each
additional unit of investment will eventually decrease.
In quality, this manifests in ways that are both predictable and
painful:
-
The first inspection step catches 60 percent of
defects. The second catches 25 percent. The third catches 10
percent. The fourth catches 3 percent. The fifth catches 1 percent.
You’ve now quintupled your inspection cost to catch that final 1
percent. -
The first round of operator training eliminates 40
percent of human errors. The second round eliminates another 20
percent. The third round eliminates 8 percent. By round five, you’re
spending a week of training to prevent two errors per year. -
The first version of your FMEA identifies 70 percent of
critical risks. Revising it for a second time captures another
15 percent. The third revision adds 5 percent. After that, you’re
rearranging RPN numbers without changing reality.
This isn’t failure. This is mathematics. And understanding it is the
difference between a quality system that serves the business and a
quality system that becomes the business — consuming resources that
should have gone to innovation, speed, and customer value.
The Three Zones of
Quality Investment
I’ve spent 25 years mapping quality investments across dozens of
organizations, and I’ve come to think of the return curve in three
distinct zones.
Zone One: The
Harvest (High Return, Low Effort)
This is where most organizations start, and it’s beautiful. Quick
wins are everywhere. Basic statistical process control on your top three
defect categories. Standard work instructions for the five most variable
stations. A simple incoming inspection on your worst-performing
supplier. A calibration program for the instruments everyone was
trusting blindly.
Organizations in Zone One often see defect rates drop by 30 to 50
percent within the first six months. The return on investment is
extraordinary — sometimes 10:1 or higher. The improvements are visible,
the data is clear, and everyone feels the momentum.
This is also where organizations get seduced. The success in Zone One
creates an expectation that the same rate of improvement will continue
forever. It won’t.
Zone Two:
The Grind (Moderate Return, Significant Effort)
This is where real quality maturity begins — and where many
organizations lose their nerve. You’ve captured the easy wins. Now
you’re dealing with the problems that don’t yield to simple solutions.
Multi-factorial defects. Supplier quality issues that require
development rather than inspection. Process capability improvements that
demand equipment investment.
In Zone Two, each percentage point of improvement costs three to five
times what it cost in Zone One. A Six Sigma project might take four
months and deliver $200,000 in savings — still worthwhile, but a far cry
from the $500,000 quick win that took three weeks last year.
This is where leadership commitment matters. Organizations that treat
quality as a program rather than a system often abandon their efforts
here. “We did Six Sigma for a year and the returns diminished.” Yes.
That’s how curves work. The question isn’t whether returns diminish —
it’s whether the remaining returns still justify the investment.
Zone Three:
The Abyss (Minimal Return, Maximum Effort)
This is where the European plant was living. Zone Three is the realm
of diminishing and eventually negative returns — where the cost of the
next improvement exceeds the value it creates.
The signs are unmistakable:
- You’re spending more time measuring quality than improving it.
- Your quality department grows faster than your production
output. - Your cost of quality is rising while your defect rate is barely
moving. - Your engineers are optimizing processes that are already
capable. - Your customers haven’t noticed the last three improvements you
made.
Zone Three is seductive because it feels virtuous. Every additional
inspection step, every additional control plan review, every additional
audit feels like diligence. It’s not. It’s waste dressed in quality’s
clothing.
The Optimization Trap
Here’s where organizations get into trouble: they confuse
optimization with maximization.
Maximization says: reduce defects as close to zero
as physically possible, regardless of cost.
Optimization says: find the point where the total
cost of quality — prevention plus appraisal plus failure — is at its
minimum, and operate there.
The classic cost-of-quality model illustrates this beautifully. As
you invest more in prevention and appraisal, your failure costs
(internal and external) decrease. But at some point, the additional
prevention and appraisal costs exceed the failure costs they prevent.
That intersection — the point where total quality cost is minimized — is
your optimal operating point.
I worked with an automotive supplier in Slovakia that was spending
€2.3 million annually on final inspection to prevent an estimated
€400,000 in warranty claims. When I presented this data to the plant
manager, he said: “But what about the recall risk?”
Fair question. So we calculated the recall risk. Based on their
defect categories, traceability system, and historical data, the
probability of a recall-causing defect escaping their existing systems
was less than 0.01 percent per year. The expected annual cost of recall
risk was roughly €35,000.
They were spending €2.3 million to prevent a €435,000 problem. That’s
not quality. That’s anxiety with a budget.
Where Diminishing Returns
Hide
The law of diminishing returns doesn’t just apply to inspection. It
lurks in every corner of your quality system, often disguised as
diligence.
Calibration
I visited a pharmaceutical manufacturer that calibrated every
measuring instrument monthly. Every single one. Including the
temperature sensors in the storage warehouse that had never drifted more
than 0.1 degrees in three years of records. The calibration technician
spent 60 percent of his time on instruments that didn’t need monthly
attention while the critical process instruments waited.
The solution wasn’t to stop calibrating — it was to calibrate based
on risk and history. High-criticality, high-drift instruments monthly.
Low-criticality, stable instruments quarterly or semi-annually. Same
confidence in measurement. Half the cost.
Documentation
A medical device company I consulted for had an average of 47 pages
of documentation per process step. Forty-seven pages. When I asked
operators how often they referenced the documentation, the honest answer
was: “When the auditor is here.”
The documentation had become so comprehensive that it was
functionally useless. Nobody could find the critical information in the
ocean of verbiage. The organization was spending more time maintaining
documents than maintaining quality.
We reduced the average to 12 pages by eliminating redundancy,
combining references, and — this was the hard part — trusting that
operators didn’t need to be told how to wash their hands on every single
work instruction.
Training
Annual refresher training is a compliance staple. But does every
employee need the same depth of refresher every year? The law of
diminishing returns says no.
An experienced operator who has performed a task 10,000 times doesn’t
get the same value from refresher training as a new hire. Yet most
organizations treat them identically. The result is training fatigue —
experienced people sitting through material they could teach, resenting
every minute, while the quality department checks a compliance box.
Smart organizations differentiate. They assess competence rather than
tracking hours. They use practical demonstrations instead of slide decks
for experienced staff. They focus refresher training on what changed,
not on what everyone already knows.
Finding Your Optimal Point
So how do you know when you’ve crossed from Zone Two into Zone Three?
How do you separate necessary quality investment from wasteful
over-engineering?
1. Track Your Cost of
Quality Religiously
If you’re not measuring prevention costs, appraisal costs, internal
failure costs, and external failure costs separately, you’re flying
blind. The trends in these four categories will tell you everything
about where you sit on the curve.
When prevention and appraisal costs rise faster than failure costs
fall, you’ve entered Zone Three.
2. Challenge Every Layer
For every control in your quality system, ask: “What would happen if
we removed this?” If the answer is “a defect would reach the customer,”
the control earns its place. If the answer is “the next inspection step
would catch it anyway,” you’ve found redundancy.
Redundancy isn’t always wrong — but it should be intentional, not
accidental. Multiple inspection steps should exist because the defect
risk justifies the redundancy, not because nobody ever questioned why
both steps exist.
3. Listen to Your Quality
People
The best indicator that you’ve overbuilt your quality system is when
your quality engineers start saying things like: “Do we really need
another layer here?” or “I think we’re over-controlling this
process.”
Quality professionals know when they’re adding value and when they’re
adding paperwork. Create an environment where they can say so without
feeling like they’re betraying their profession.
4. Follow the Customer Signal
Your customers will tell you when you’ve optimized. If customer
complaints are stable and low, warranty costs are predictable and
acceptable, and your delivery performance is strong, you don’t need
another improvement initiative. You need to sustain what you have and
invest your resources elsewhere — in new products, new markets, or new
capabilities.
The Paradox of Continuous
Improvement
Here’s the uncomfortable truth that the continuous improvement
movement doesn’t like to acknowledge: not every process needs to be
continuously improved. Some processes need to be continuously
maintained.
There is profound value in stability. A process that runs at Cpk 1.67
and hasn’t drifted in two years doesn’t need a Six Sigma project. It
needs a control plan, a monitoring system, and the discipline to leave
it alone.
The impulse to improve everything, everywhere, all the time is not
continuous improvement. It’s continuous disruption. And it carries its
own cost — change fatigue, process instability, training overhead, and
the erosion of organizational competence in processes that people never
get to master because they’re always changing.
The mature quality organization knows which processes to improve,
which to maintain, and which to leave alone entirely. That judgment —
knowing where to invest and where to stop — is worth more than any
statistical tool.
The Cost of Not Knowing Your
Curve
I’ll close with another story. That European plant with 340
inspectors? They didn’t listen to the data. They added another layer of
inspection instead. Then another audit. Then a quality council that met
weekly to review every defect above a severity threshold they kept
lowering.
Within 18 months, their cost of quality had risen to 23 percent of
revenue. For context, world-class manufacturers operate at 2 to 5
percent. The plant was spending nearly a quarter of its revenue on
quality activities — and still had a 0.9 percent defect rate.
The board eventually intervened. Not because of the defect rate —
which was, by any reasonable standard, excellent — but because the plant
was losing money. The quality system had become so expensive that the
products it was protecting were no longer profitable.
They reduced inspection to three targeted stations. They invested in
prevention instead of detection. They accepted that 0.5 percent was a
more appropriate target than 0.1 percent for their product category and
customer expectations. Within a year, their cost of quality dropped to 7
percent, their defect rate rose slightly to 0.6 percent, and their
profitability more than doubled.
Their customers never noticed the difference.
That’s the law of diminishing returns in quality. Not a limitation.
Not a failure. A compass. It tells you where to stop digging and start
building something else.
Peter Stasko is a Quality Architect with 25+ years
of experience transforming organizations across automotive, aerospace,
and pharmaceutical industries. He specializes in helping companies find
the optimal balance between quality investment and business performance
— because excellence isn’t about spending more, it’s about spending
wisely.