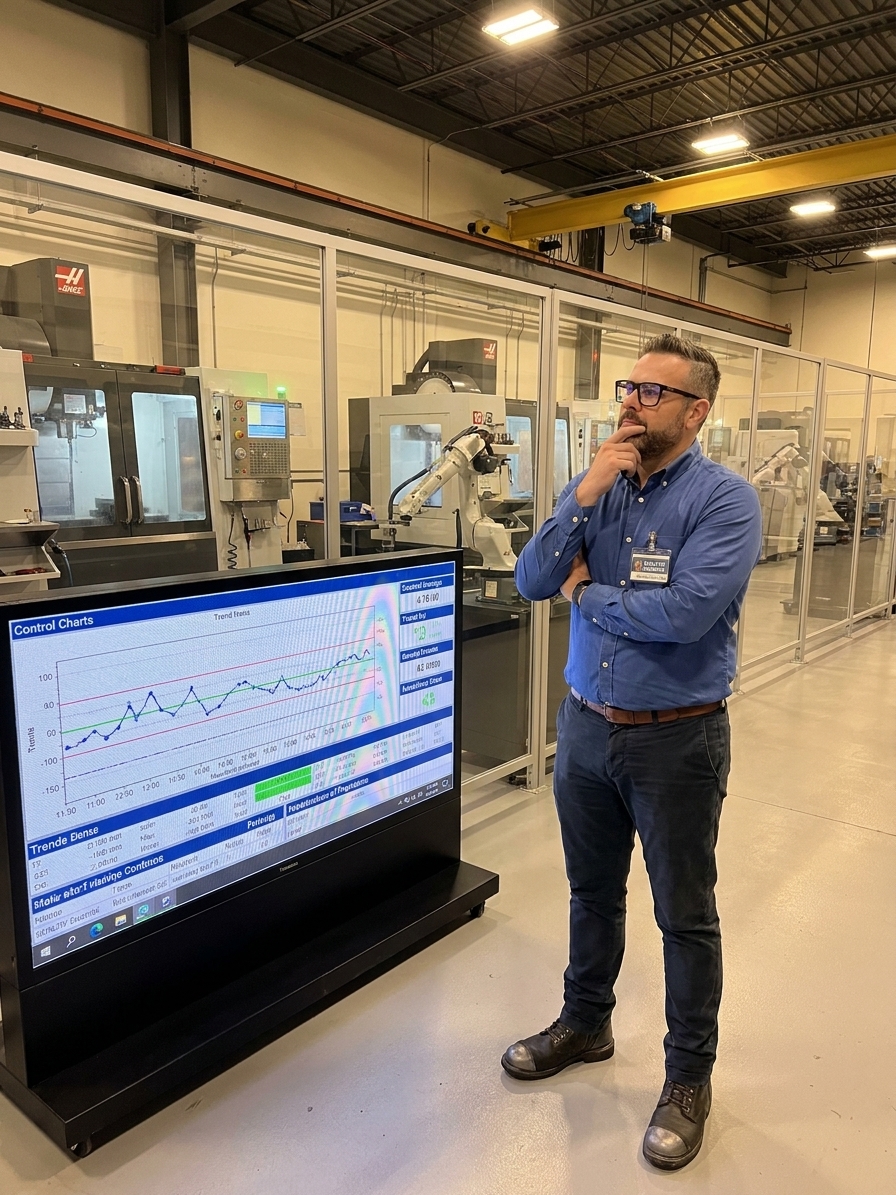
A single customer return can rewrite an entire plant's quality strategy. I have seen a VP of Manufacturing drop one defective part on a conference table and trigger forty-eight hours of chaos: a new inspection station, a revised control plan, and an 8D report stamped URGENT. The organisation mobilised as if a systemic failure had occurred.
Meanwhile, the same plant had produced 4,200 parts per month at a stable 0.3 percent defect rate for three consecutive years. The process was well within its Cpk targets. The long-term data proved the system was highly capable, but the statistical evidence was completely overwritten by a single, recent event.
This is the Recency Effect in action. It is a cognitive bias where human memory disproportionately weights the most recent events. In daily life, this mental shortcut is harmless. In quality management, where decisions must be driven by long-term SPC trends and capability indices, it becomes a systematic source of operational error and wasted resources.
The Mechanics of Recency Bias in SPC
The human brain prioritises recent information because it is stored in highly accessible, vivid short-term memory. A supplier screaming on the phone this afternoon generates a stronger emotional response than a data table showing a slow capability decline across two quarters. Emotion amplifies memory, and memory ultimately drives the allocation of engineering resources.
This evolutionary trait is disastrous for statistical process control. A process that produces 50,000 conforming parts might suddenly yield five rejects in a single shift. Leadership treats this as a catastrophic failure, halting production and pulling engineers from critical projects. However, when plotted on an I-MR chart, that spike often falls entirely within expected variation.
The organisation has confused recency with significance. They have reacted to common cause variation as if it were a special cause. By treating statistical noise as an emergency, management exhausts its quality budget on phantom problems while ignoring the slow, quiet drift that actually precedes massive failure.
Recency-Driven Reaction vs Data-Driven Response
What recency drives
- Emergency 8D for random common-cause variation
- Adding 100% manual inspection after a single in-tolerance spike
- Disqualifying a proven Tier 1 supplier over three bad parts
- Shifting CAPA focus entirely to this week's defect mode
What SPC dictates
- Monitor the control chart for Nelson rule violations before acting
- Verify process capability (Cpk) before altering the control plan
- Evaluating the supplier's 24-month defect rate for systemic risk
- Using rolling Pareto analysis to prioritise systemic failures

The Danger of Underreacting to Developing Trends
The flip side of overreaction is equally dangerous. A process can drift toward its specification limit for six months without triggering a single escape. Each individual data point remains technically within spec. Because the most recent readings pass inspection, the Recency Effect convinces operators and engineers that the process is healthy.
Because the brain anchors to the last point on the chart rather than the trajectory, nobody notices the gradual shift. By the time the process finally breaches the upper specification limit and generates a customer complaint, the trend has been active for half a year. The resulting corrective action is massive, costly, and entirely preventable.
This is particularly insidious in high-turnover environments. A new quality engineer inherits the most recent narrative but has no personal memory of the historical context. Without rigorous documentation and accessible trend data, the engineer relies entirely on the previous week's performance. An organisation with no accessible institutional memory is condemned to react to whatever happened last.
How Recency Distorts Audits and Resource Allocation
Auditors are human, which makes them highly susceptible to recency bias. An auditor who uncovers a major nonconformance in the final process of an AS9100 audit may disproportionately weight that finding in their final report. Systemic issues noticed but not fully documented earlier in the day get underweighted, skewing the audit's value.
Organisations that stage their audit routes—intentionally placing their strongest, most compliant processes at the end of the VDA 6.3 assessment—often exploit this cognitive flaw. Whether the routing is strategic or accidental, timing alters the emphasis of the findings. The sequence of the audit directly corrupts the objectivity of the audit report.
Quality budgets are finite. When a recent event dominates organisational memory, capital and engineering hours flow disproportionately toward that single event. A complaint from last week receives a cross-functional team. A near-identical complaint from eight months ago, representing a far larger systemic risk, gets ignored because it is no longer vivid.
The Recency Effect effectively becomes your prioritisation system, and it is a terrible one.
Engineering Systemic Countermeasures Against Bias
You cannot train people out of cognitive bias with a presentation. You must engineer the bias out of your management system. This means altering the structure of quality reviews, the logic of escalation, and the design of your dashboards. Systemic problems require systemic countermeasures, not increased vigilance.
Start by mandating long-term trend reviews in every quality meeting. Before anyone is allowed to discuss current events, the team must review the last twelve months of data. Pareto analysis, capability indices, and OEE metrics must be presented across the full time horizon. A spike that looks alarming in isolation looks completely normal against twelve months of control chart data.
Next, implement formal statistical filters for incident escalation. If a recent defect does not trigger a Western Electric rule or a Nelson rule, it must be documented and tracked, but it does not get an emergency response. This forces the organisation to respond proportionally, replacing subjective emotional impressions with objective statistical thresholds.
Validating Recent Defects Against Historical Data
- 01Identify the defect eventLog the recent failure mode and immediately isolate the data for the affected production shift.
- 02Apply statistical rulesPlot the event on the SPC chart and check for Nelson rule violations before escalating.
- 03Review historical contextPull the 90-day and 365-day capability data to establish the true baseline performance.
- 04Categorise the variationDetermine definitively if the defect represents common cause noise or a true special cause.
- 05Allocate resourcesTrigger an emergency 8D only if the event breaches statistical thresholds or systemic risk is confirmed.
Separating Incident Response from Strategic Priority
The urgency of a recent event must not hijack the organisation's long-term quality strategy. Create two distinct workflows within your QMS. One handles immediate incident response: containing the damage, protecting the customer, and stabilising the line. The other handles strategic resource allocation based on long-term risk assessment.
The incident response team executes containment. The strategic team reviews the last two years of data to determine where to invest engineering time and capital. By physically separating these functions and their meeting cadences, you prevent the emotional volume of a recent escape from drowning out the analytical reality of a slow capability decline.
Implement rolling window analysis across all quality metrics. Present 30-day, 90-day, and 365-day views side by side. A defect rate that looks catastrophic in a 7-day window often looks perfectly stable in a 90-day window. Multiple time horizons force the viewer to contextualise recent events, diluting the cognitive impact of the latest data point.
Building an Anti-Recency Quality Culture
Continuous improvement programs can be hijacked by recency. If every kaizen event addresses whatever problem was most visible this week, the improvement trajectory becomes a random walk. The best CI programs balance rapid-cycle improvement with long-term strategic direction driven by data and leadership discipline. Both are necessary.
I have audited plants where the quality dashboards defaulted to a 7-day view. This explicitly feeds the Recency Effect by hiding the broader pattern. Configure your QMS dashboards to default to the last twelve months. Let operators and engineers zoom in if they need to inspect a specific shift, but force the default view to present the long-term historical context.
Finally, rotate your internal audit sequences regularly. If your audit program consistently follows the same path through the plant, recency bias will systematically distort findings at the end of each cycle. Assign different auditors to different segments and randomise the sequence. This breaks the connection between timing and evaluation emphasis.
Key Thresholds for Anti-Recency Quality Management
Data as the Institutional Memory
I recall a Tier 1 automotive supplier that received three consecutive non-conforming batches from a component source. The immediate reaction was to issue a supplier corrective action request and begin qualifying an alternative vendor. The alternative supplier had recently submitted a perfect sample lot, and that vivid recent success dominated the team's assessment.
When the quality engineer pulled the 24-month data, the narrative inverted. The incumbent supplier had delivered 847 consecutive conforming batches with an overall defect rate of 0.04 percent. The alternative supplier actually carried a 0.8 percent defect rate—twenty times worse. The Recency Effect was actively steering the plant away from a world-class supplier toward an inferior one.
The lesson is simple: the data was always available, but the bias was in choosing not to look at it. Documentation, archival, and trend analysis matter not for IATF 16949 compliance, but because they provide the institutional memory required to override human cognitive flaws. Without accessible historical data, every quality decision is made as if the plant has amnesia.