From Spreadsheets to AI: The Quality Manager’s Migration Path
“How is it 2026 and we’re still just spreadsheets and consultants? Every audit cycle feels like Groundhog Day.” — anonymized quote from a LinkedIn discussion that got 1,200 reactions in 48 hours.
I felt that in my bones. Because I was that person.
The Spreadsheet Trap
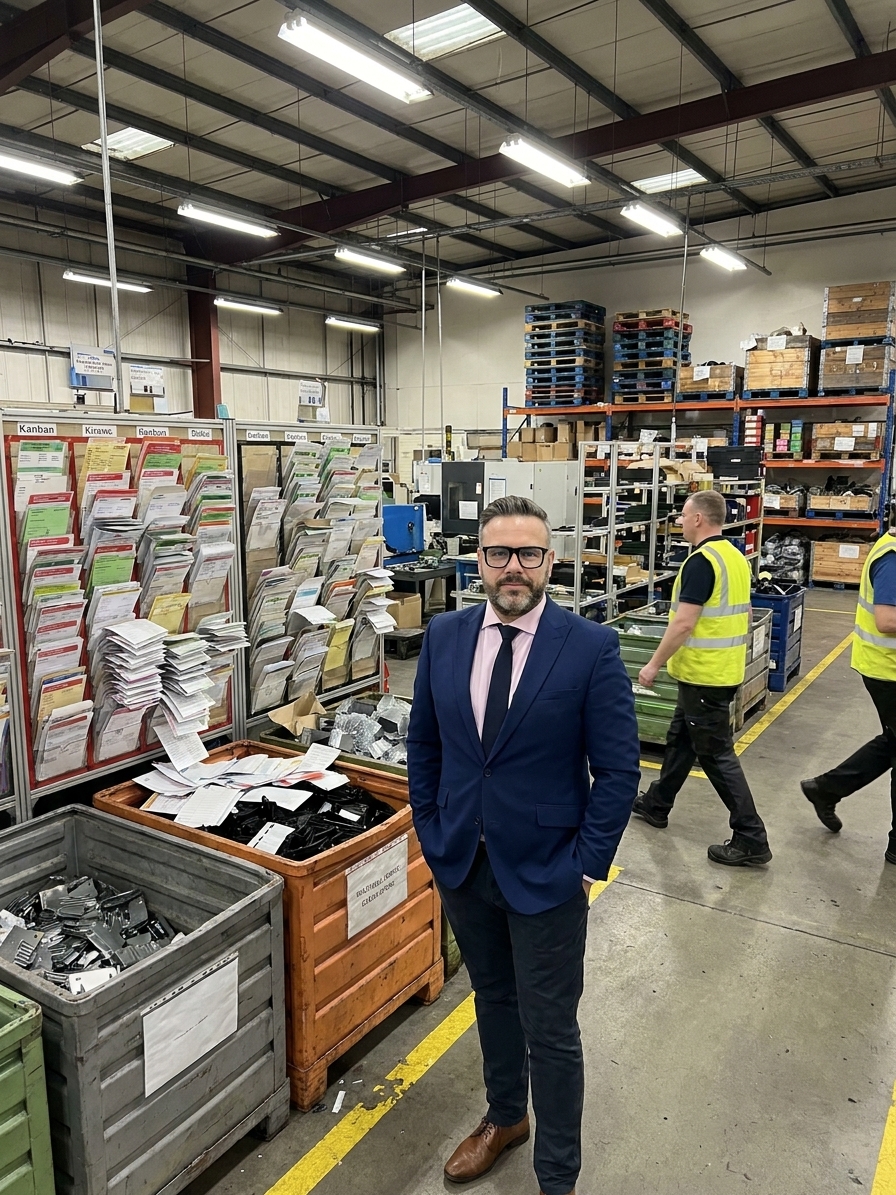
Let me paint a picture. At ArcelorMittal, our quality management system ran on:
- 47 Excel spreadsheets tracking nonconformities
- 12 different versions of the “master” corrective action log (none of which were actually master)
- 3 SharePoint sites with conflicting document versions
- 1 Access database that only one person knew how to use (and she was retiring in 6 months)
- Approximately 8,000 emails per year containing quality data as attachments
This wasn’t a small company. This was a Fortune 500 manufacturer. And our quality data management was a disaster.
We’re not alone. In a 2025 survey of 340 manufacturing quality managers, 78% said spreadsheets were their primary quality data tool. 62% said they spent more time managing data than analyzing it. 44% admitted to losing quality data due to version control issues.
The LinkedIn post resonated because it described a universal problem. But recognition isn’t action. Let me tell you how to actually migrate.
The Five Stages of Quality Data Maturity
I’ve developed this framework from migrating three manufacturing companies from spreadsheet chaos to AI-augmented quality management. Each stage represents a fundamental shift in how quality data is managed and used.
Stage 1: Spreadsheet Chaos (Where Most Start)
Symptoms:
- Quality data lives in individual spreadsheets
- No single source of truth
- Version conflicts are normal
- Audit preparation is a data reconstruction project
- Trend analysis is manual and infrequent
- People hoard data as job security
Cost of staying here: At ArcelorMittal, I calculated we were spending €180,000/year in wasted time — people searching for data, reconciling versions, recreating lost spreadsheets, and preparing reports that nobody trusted.
The pain point: You know you’re here when your quality manager’s biggest fear isn’t the next audit — it’s the next time someone asks “Can you send me the latest version of the nonconformity log?”
Stage 2: Centralized Storage (The First Escape)
What changes: Quality data moves to a shared system — a proper QMS, a centralized database, or at minimum a well-governed SharePoint structure with version control.
What it takes:
- Select a QMS platform (or structure your existing tools properly)
- Define data standards (what gets recorded, how, in what format)
- Migrate existing data (painful but necessary)
- Train people on the new system
- Enforce usage (this is where most implementations fail)
Real example: At Norgren, we moved from spreadsheets to a cloud-based QMS in 4 months. The migration was brutal — 3,200 nonconformity records, 850 corrective actions, and 1,400 supplier quality records had to be cleaned and migrated. But the payoff was immediate:
- Version conflicts: eliminated
- Data retrieval time: 73% reduction
- Audit preparation time: from 6 weeks to 3 weeks
- Trend reporting: from quarterly (manual) to on-demand (automatic)
The trap: Many organizations stop here. They think “we have a QMS now, we’re done.” But a QMS is a data repository, not a data intelligence tool. You’ve centralized your data, but you’re still doing all the thinking.
Stage 3: Process Automation (Where Efficiency Starts)
What changes: Manual processes become automated workflows. Document approvals, corrective action routing, internal audit scheduling, management review data collection — all automated.
What it takes:
- Map every quality process end-to-end
- Identify manual handoffs and approvals
- Build workflow automation in your QMS or using integration tools
- Connect quality processes to operational systems (ERP, MES, CRM)
- Establish real-time dashboards
Real example: At Airbus, we automated our corrective action workflow. Before: an 8D report moved through 6 approval steps, taking an average of 23 days. After automation: the same 8D moved through 6 steps in 4 days, with automatic notifications, escalation rules, and parallel approvals where possible.
The cascading effect was significant. Faster corrective actions meant problems were fixed sooner, which meant fewer repeat nonconformities, which meant less rework. Our cost of poor quality dropped by 31% in the first year.
Key metrics at Stage 3:
- Document approval cycle: 70-85% faster
- Corrective action closure time: 50-65% faster
- Internal audit on-time completion: 95%+ (was typically 60-70%)
- Management review preparation: 75% less effort
Stage 4: Predictive Analytics (Where Quality Becomes Proactive)
What changes: Instead of reacting to problems, you start predicting them. Statistical process control becomes real-time. Trend analysis becomes predictive. You move from “what happened?” to “what will happen?”
What it takes:
- Clean, structured historical data (Stages 2-3 prerequisite)
- Statistical analysis tools (basic SPC to start, machine learning later)
- Process monitoring connected to quality outcomes
- A team that can interpret and act on predictions
Real example: At ArcelorMittal, we connected our rolling mill process parameters to our quality outcomes using predictive models. The system could predict dimensional nonconformities 45 minutes before they occurred, based on temperature and pressure patterns.
When we acted on those predictions — adjusting parameters proactively — our dimensional scrap rate dropped from 2.1% to 0.7%. On a production volume of 40,000 tons/month, that saved €340,000/month.
The mindset shift: This is where quality stops being a cost center and becomes a value creator. When you predict and prevent defects, quality management generates measurable ROI.
Stage 5: AI-Augmented Quality (The Current Frontier)
What changes: AI agents handle routine quality decisions. They monitor compliance, generate insights, draft corrective actions, and even interact with suppliers. Humans focus on strategy, relationships, and complex problem-solving.
What it looks like in practice:
An AI agent monitors your production line in real-time. It detects a drift in a critical parameter. Instead of just alerting you, it:
- Checks the historical pattern — has this drift occurred before?
- Reviews the corrective action database — what was done last time?
- Evaluates effectiveness — did the previous corrective action work?
- Drafts a recommendation based on what worked
- Routes it to the right person with all context attached
- Audit your current state. List every spreadsheet, every database, every system that holds quality data. You can’t migrate what you don’t know exists.
- Choose your platform. This doesn’t have to be a six-figure QMS. Start with what you have and make it work. I’ve seen companies build effective Stage 2 systems in Airtable and Notion.
- Clean your data. This is 60% of the effort and 90% of the value. Garbage in, garbage out applies to every subsequent stage.
- Define governance. Who owns what data? Who can edit? How are changes tracked?
- Process map everything. You can’t automate what you don’t understand.
- Start with one process. Usually corrective actions, because the ROI is fastest.
- Measure before and after. You need data to prove the investment worked.
- Expand gradually. Once people see the first workflow working, adoption becomes pull, not push.
- Connect quality to operations data. Predictive quality requires process data, not just quality records.
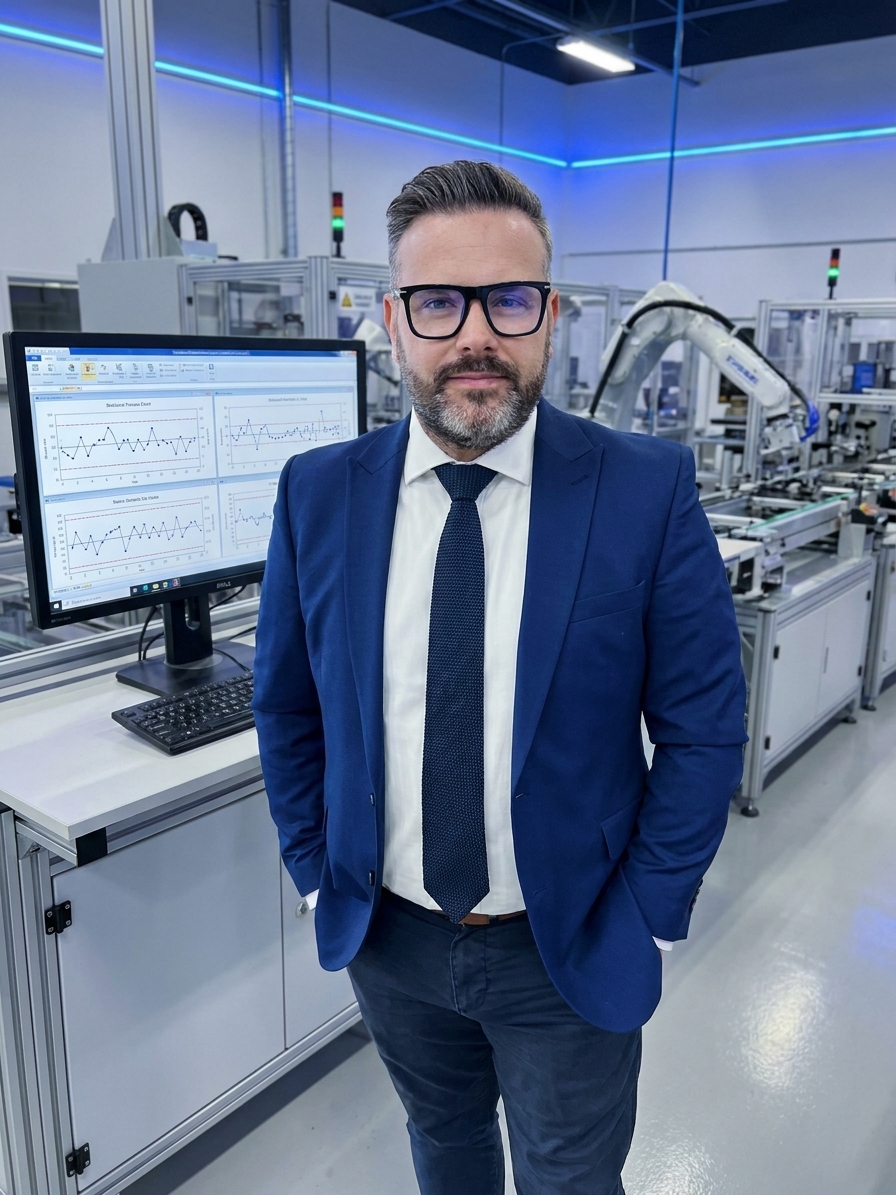
- Start with simple SPC. You don’t need machine learning on day one. Real-time control charts with automatic alerts are transformative if you’re coming from manual tracking.
- Build your data science capability. Hire one analytically-minded quality engineer. Or train an existing one. You don’t need a team — you need one person who gets it.
- This is where Velin comes in. Implementing AI agents requires platform investment and integration work.
- Start with a narrow use case. Document review or CAPA drafting are good entry points.
- Keep humans in the loop. The best results come from AI recommendations with human decisions.
- Scale what works. Once one use case proves itself, expand to others.
- Data quality is everything. Every AI implementation I’ve seen struggle was a data quality problem, not a technology problem. Fix your data first.
- People matter more than platforms. The best QMS in the world is useless if your team won’t use it. Invest in training, change management, and quick wins.
- The migration never ends. Quality data management isn’t a project with an end date. It’s a capability you build and continuously improve.
At Norgren, we implemented this for our machining center. The AI agent handled 67% of routine parameter adjustments autonomously. Engineers were freed to focus on process improvement instead of firefighting. Machining scrap dropped 22% in six months.
The Migration Path: Practical Steps
You can’t jump from Stage 1 to Stage 5. I’ve seen organizations try, and it always fails. Here’s the proven path:
From Stage 1 to 2: The Foundation (3-6 months)
From Stage 2 to 3: The Automation (4-8 months)
From Stage 3 to 4: The Intelligence (6-12 months)
From Stage 4 to 5: The AI Augmentation (6-18 months)
What I Wish Someone Had Told Me
Three things I learned the hard way:
The person on LinkedIn was right to be frustrated. Spreadsheets and consultants in 2026 is a choice, not a necessity. The tools exist. The methodology is proven. The path is clear.
The only question is: when do you start walking it?
See Velin in Action
If you’re ready to move beyond spreadsheets and start your migration toward AI-augmented quality management, Velin is built for every stage of this journey.
From data centralization to process automation to AI-augmented decision-making, Velin meets you where you are and helps you move to the next stage. No rip-and-replace. No six-figure implementations. Just practical, proven AI agents that make quality management work better.
Book a demo and see how your quality data can finally start working for you.
Peter Stasko has migrated three manufacturing companies from spreadsheet chaos to AI-augmented quality. 25+ years in the trenches. Certified ISO 9001 Lead Auditor and Six Sigma Black Belt. He built Velin because he lived the spreadsheet nightmare — and never wants to go back.