Most manufacturing executives can tell you their scrap rate to two
decimal places. Ask them what quality actually costs — not the scrap,
not the warranty claims, but the total cost of quality from prevention
through failure — and you’ll get silence, a guess, or a number that’s
off by an order of magnitude.
This isn’t an accident. The Cost of Quality, or COQ, is one of the
oldest and most powerful frameworks in manufacturing quality management,
and also one of the most consistently ignored. Armand Feigenbaum
introduced the concept in the 1950s. Philip Crosby popularized it in the
1970s with his famous assertion that “quality is free.” Juran refined it
into the model most organizations use today. And yet, in 2026, the vast
majority of manufacturing plants still treat quality cost as synonymous
with “the cost of the quality department” — salaries, inspection
equipment, calibration services — while the real costs, the ones that
determine whether a factory thrives or dies, remain invisible in
overhead accounts, expedited freight charges, and customer line-down
penalties that nobody aggregates into a single number.
This article is about why that happens, what the real cost of quality
looks like when you measure it honestly, and why the organizations that
figure this out don’t just improve their quality — they fundamentally
change their competitive position.
The
Four Categories: A Framework You Probably Learned and Never Used
COQ divides quality costs into four categories. You’ve seen them
before. The question is whether your organization actually uses
them.
Prevention costs are what you spend to keep defects
from happening in the first place. Training. Process design. Quality
planning. Supplier evaluation. FMEA. APQP. Design reviews. Preventive
maintenance. These are investments in getting it right the first
time.
Appraisal costs are what you spend to determine
whether you got it right. Inspection. Testing. Audits. Calibration.
Incoming material checks. Final inspection. SPC data collection. These
are investments in catching it before it reaches the customer.
Internal failure costs are what you spend when you
catch defects before they leave your plant. Scrap. Rework. Reinspection.
Downgrading. Line shutdowns. Sort activities. Machine downtime from
quality issues. These are the costs of failure that stayed inside.
External failure costs are what you spend when
defects reach the customer. Warranty claims. Returns. Field repairs.
Customer line-down penalties. Recalls. Legal liability. Lost business.
Reputation damage. These are the costs of failure that escaped.
The standard model holds that prevention and appraisal are “cost of
conformance” — the price of achieving quality — while internal and
external failure are “cost of non-conformance” — the price of failing to
achieve it. The insight that drives the framework is simple: as you
invest more in prevention, both appraisal and failure costs decrease,
and the total cost of quality goes down. Quality is not free, but
investing in quality costs less than paying for the absence of it.
This is not controversial. It’s not new. It’s not complicated. And
most organizations still don’t do it.
Why
Your Cost of Quality Numbers Are Wrong (If You Have Them At All)
Let’s start with the organizations that don’t measure COQ at all.
This is the majority. Their finance department tracks direct labor,
materials, overhead, and maybe “scrap” as a line item. Rework is buried
in labor costs. Expedited shipping to replace defective parts is buried
in logistics. Customer quality engineers’ salaries are buried in sales
or customer service. Warranty is in a separate budget that the quality
department never sees. The training budget is in HR. The calibration
budget is in maintenance. Nobody rolls any of it up into a single
view.
The result: the CEO asks “what does quality cost us?” and gets an
answer that’s maybe 20-30% of the real number. The visible costs — the
quality department’s budget, the scrap report — are the tip of an
iceberg. Under the waterline: expedited freight, overtime to rework
parts, customer engineers flying out to contain defects, engineering
change orders to fix designs that should have been right the first time,
inventory buffers to compensate for unreliable processes, and the
opportunity cost of capacity consumed by making things twice.
Now consider the organizations that do measure COQ. Many of them
still get it wrong because of what they choose to include and exclude.
The most common manipulation is undercounting external failure costs.
Warranty claims are visible, but lost future business from a
dissatisfied customer is not. Customer line-down penalties show up as a
chargeback, but the engineering resources diverted to contain the issue
don’t. A recall is catastrophic and measurable, but the slow erosion of
customer confidence that precedes it — the customer who stops sending
new programs your way, the bid you lose without knowing why — is
invisible until it’s too late.
Another common distortion: counting appraisal costs as prevention.
Running more inspections is not prevention. Adding another layer of
end-of-line testing is not prevention. These are appraisal activities.
They catch defects. They don’t prevent them. Prevention happens upstream
— in design, in process engineering, in supplier selection, in operator
training. If your COQ breakdown shows appraisal growing while prevention
stays flat, you’re not improving quality. You’re just building a more
expensive sieve.
The Typical
Ratio and Why Yours Should Terrify You
In a well-run manufacturing operation, the target COQ distribution
looks roughly like this:
- Prevention: 20-30% of total COQ
- Appraisal: 20-30%
- Internal failure: 20-30%
- External failure: 10-20%
Total COQ in a world-class organization runs about 5-10% of
revenue.
In a typical manufacturing operation — not terrible, not great — the
distribution looks more like this:
- Prevention: 5-10%
- Appraisal: 15-25%
- Internal failure: 30-40%
- External failure: 20-30%
Total COQ: 15-25% of revenue.
In a struggling operation, prevention is minimal, appraisal is high,
and failure costs — especially external — dominate. Total COQ can exceed
30% of revenue. I’ve seen plants where the real cost of quality,
properly measured, exceeded their profit margin. They were literally
losing money on every part and making it up on volume, as the old joke
goes.
Here’s the critical pattern: organizations with low total COQ invest
heavily in prevention. Organizations with high total COQ spend almost
nothing on prevention and pour money into failure. The relationship is
not linear — it’s exponential. Small increases in prevention spending
produce disproportionately large reductions in failure cost. This is the
Crosby argument: the incremental investment in prevention is always less
than the failure cost it eliminates.
The
Prevention Multiplier: Why One Dollar Upstream Saves Ten Downstream
The reason prevention is so powerful is the defect multiplication
effect. A design error caught in the concept phase costs virtually
nothing to fix. The same error caught in detailed design costs ten times
as much. Caught during prototype testing, a hundred times. Caught during
production launch, a thousand times. Caught by the customer, ten
thousand times or more.
This multiplier exists because each stage of the product lifecycle
adds commitments that are expensive to undo. Once you’ve released a
design, changes require engineering time, tooling modifications, and
supplier coordination. Once you’ve built tooling, changes require rework
or replacement of physical assets. Once you’ve started production,
changes require scrap or rework of existing inventory, line
reconfiguration, and requalification. Once parts are in the field,
changes require sorting, shipping, potential recalls, and customer
relationship repair.
Every dollar spent on prevention — design reviews, FMEA, simulation,
prototype testing, process validation — intercepts defects at the stage
where they’re cheapest to fix. This is why the APQP framework exists:
not as bureaucratic overhead, but as a structured mechanism for moving
defect detection upstream. When organizations complain that APQP is “too
expensive” or “takes too long,” they’re almost always comparing the
visible cost of prevention to the invisible cost of the failures they
haven’t measured.
The
Appraisal Trap: When Inspection Becomes a Substitute for Capability
Many organizations fall into what I call the appraisal trap. They
have quality problems. They respond by adding more inspection. More
inspectors, more gauges, more end-of-line tests, more sorting
operations. The appraisal budget grows. Internal failure costs grow too,
because the additional inspection catches more defects — which then
require disposition. Prevention stays flat.
In the short term, this looks like improvement: the customer sees
fewer defects because more are being caught internally. But the total
cost of quality is actually increasing. You’re spending more to catch
the same defects you should be preventing. And the system is fragile:
skip one inspection, reduce one sort, and the defects immediately reach
the customer because nothing has changed in the process that produces
them.
The appraisal trap is seductive because inspection feels like action.
You can see the inspectors. You can count the tests. You can show the
customer your detection rate. What you can’t see is that you’re paying
to compensate for a process that isn’t capable, and every dollar you
spend on detection is a dollar you didn’t spend on making detection
unnecessary.
World-class organizations use inspection strategically — as a
validation step, not a filtering step. The goal is not to catch every
defect. The goal is to have so few defects that catching them is
trivial. When your process produces 3.4 defects per million
opportunities (the Six Sigma target), you don’t need an army of
inspectors. You need a handful of verification checks to confirm that
the process is still performing as designed.
Measuring COQ: A
Practical Starting Point
If your organization doesn’t measure COQ today, don’t try to build a
perfect system on day one. Start with the 80/20 approach:
Month one: Identify the five largest quality cost
items in each category. Don’t worry about completeness. Get the big
numbers: scrap value, warranty claims, inspection headcount, key
training programs. Estimate what you can’t measure directly. The goal is
to get a directional picture, not an auditable financial statement.
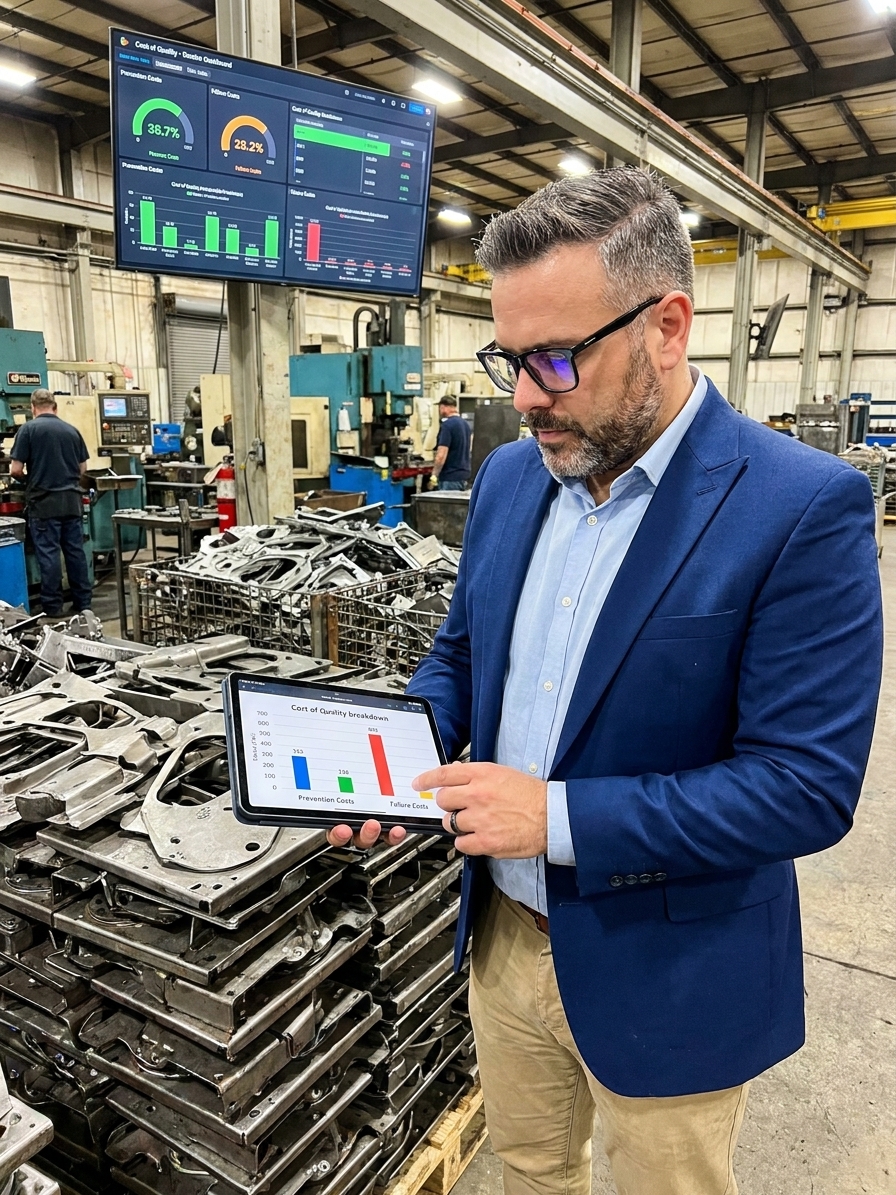
Month two: Start tracking these items monthly. Build
a simple dashboard — spreadsheet is fine. Watch the trends. The first
time you show your leadership team a COQ trend chart that shows external
failure costs three times higher than prevention costs, the conversation
changes.
Month three: Identify one prevention investment with
a clear ROI. Maybe it’s additional operator training on the line with
the highest scrap. Maybe it’s a process improvement project on your
worst-capability dimension. Maybe it’s a supplier development program
for the vendor causing the most incoming rejections. Calculate the
expected reduction in failure cost. Make the investment. Measure the
result.
Ongoing: Expand the measurement. Add more cost
items. Refine the allocation methods. Connect COQ to specific
improvement projects so you can show the financial return of quality
investments in terms your CFO understands.
The
Cultural Barrier: Why Finance and Quality Don’t Speak the Same
Language
The biggest obstacle to effective COQ management isn’t technical —
it’s cultural. Quality professionals speak in terms of defects,
capability indices, and risk numbers. Finance professionals speak in
terms of costs, margins, and return on investment. When the quality
manager asks for investment in prevention, the conversation often goes
like this:
Quality: “We need $50,000 for process validation on the new line.”
Finance: “What’s the ROI?” Quality: “It’ll reduce our defect rate.”
Finance: “By how much, and what’s that worth in dollars?” Quality:
[silence]
The quality professional can’t answer the question because they don’t
have the COQ data to quantify the failure cost they’re trying to
prevent. The finance professional can’t help because they don’t
understand the quality system well enough to estimate the failure risk.
The investment doesn’t get made. The failure cost continues. Nobody
connects the dots.
This is why measuring COQ is not just a finance exercise or a quality
exercise — it’s a translation exercise. It converts quality outcomes
into financial language. Once you can say “this $50,000 investment in
prevention will eliminate an estimated $200,000 in annual internal
failure cost and $100,000 in warranty exposure,” the conversation shifts
from “should we invest in quality?” to “which quality investments have
the highest return?” — which is exactly where you want to be.
The Long Game: COQ as
Competitive Strategy
Organizations that master COQ don’t just improve their quality
metrics. They change their cost structure. When your total COQ is 5% of
revenue and your competitor’s is 20%, you have a 15-point margin
advantage. You can invest that in R&D, in price competitiveness, in
capacity, in people. Your competitor is spending that 15% on scrap,
rework, warranty, and customer recovery — activities that create zero
value for the customer.
Over time, this advantage compounds. Lower failure costs mean more
resources for prevention, which means lower failure costs, which means
more resources for innovation. Your quality improves, your costs
decrease, your customers notice, and your market position strengthens.
Meanwhile, your competitor is trapped in a cycle of firefighting that
consumes the resources they need to break free.
This is the real lesson of the Cost of Quality: it’s not about
measuring costs for measurement’s sake. It’s about understanding where
your quality money goes and making sure it goes to the place where it
generates the highest return — prevention. Every dollar spent preventing
defects saves multiples of that dollar in failure costs downstream. The
math is simple. The discipline to act on it is what separates
world-class manufacturers from the rest.
Peter Stasko is a Quality Architect with over 25
years of experience in manufacturing quality management, process
improvement, and quality system design. He has helped organizations
across automotive, aerospace, and industrial manufacturing understand
and reduce their true cost of quality.