The Stack That
Was Supposed to Tell the Truth
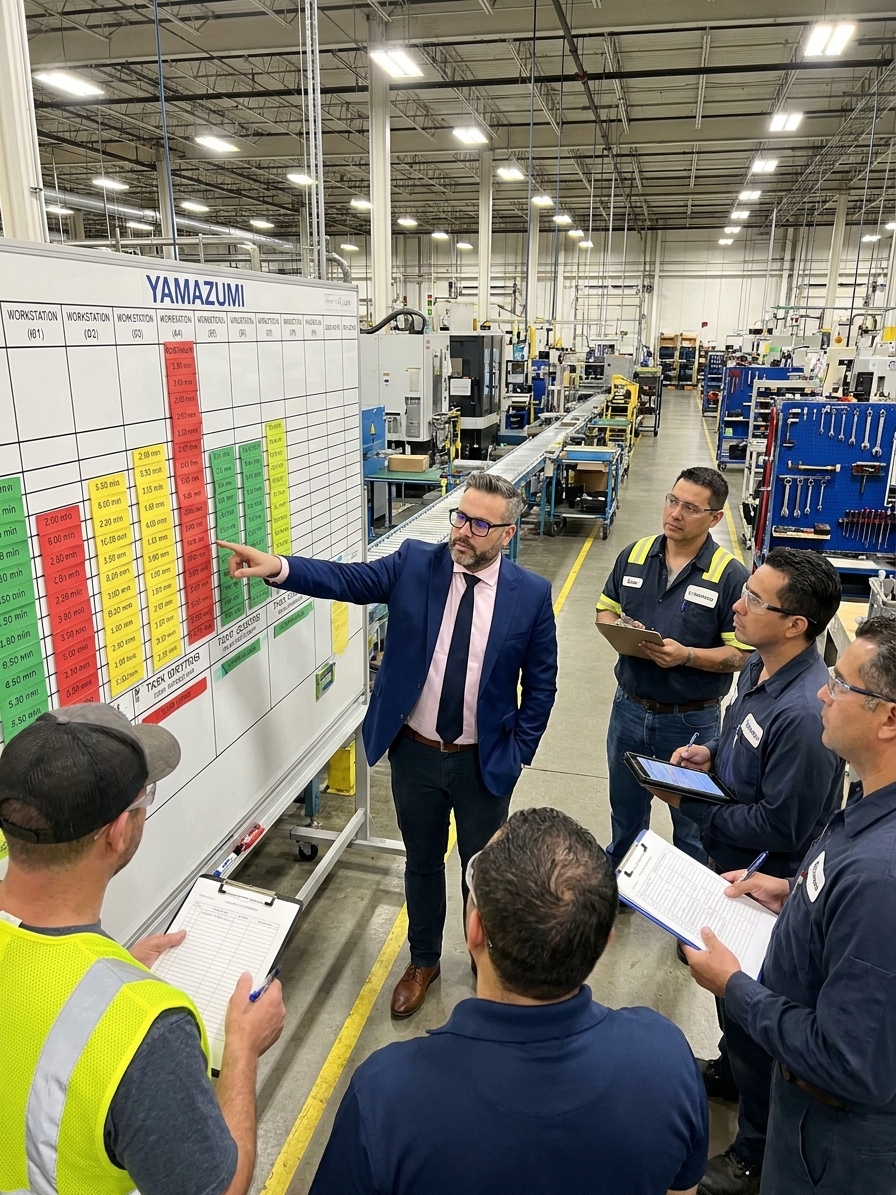
A Yamazumi board is simple. You take every task in a process, write
each one on a colored strip of paper, and stack them vertically by
station. The tallest stack is your bottleneck. The shortest stack is
your wasted capacity. The unevenness between them — mura — is
the thing you’re supposed to fix.
That’s it. That’s the tool.
A properly constructed YamazumI board makes the invisible visible. It
shows, in a single glance, where work piles up, where operators are
drowning, and where stations sit idle waiting for the next part. It’s
one of the most powerful diagnostic instruments in lean manufacturing
because it doesn’t require software, dashboards, or statistical
training. It requires honesty.
And that’s exactly where it falls apart.
What the Board Is Supposed to
Do
The Yamazumi board (山積み, literally “mountain-piling”) originated
in Toyota’s production system as a manual visualization tool for line
balancing. Each colored strip represents a specific task — green for
value-added work, yellow for incidental work, red for waste (muda). The
strips are grouped by workstation and stacked to form bar-chart-like
columns.
The purpose is threefold:
-
Identify the bottleneck. The tallest column is
the constraint. That station governs the output of the entire line. No
improvement anywhere else matters until you reduce that stack. -
Reveal imbalance. The difference between the
tallest and shortest columns is mura — unevenness. It
represents the waste of waiting, the waste of overproduction, and the
stress placed on operators at overloaded stations. -
Guide kaizen. The board isn’t a report. It’s a
planning surface. You physically move strips between columns to simulate
rebalancing. You pull red strips out and ask why they exist. You break
green strips into smaller pieces to redistribute load. The board is
where the improvement conversation happens.
When used correctly, a Yamazumi board drives a relentless question:
How do we make every column the same height?
When used incorrectly, it becomes a decoration.
Where It Goes Wrong
The Board Becomes a Museum
Exhibit
The most common failure mode is also the most predictable: the team
builds the board once, presents it to management during a lean rollout
event, photographs it for the audit binder, and never touches it
again.
The strips yellow. The tape peels. The process changes — new product
variants, new cycle-time targets, new equipment — but the board stays
frozen at the moment someone cared enough to build it.
A Yamazumi board that isn’t updated is worse than no board at all. It
presents stale fiction as current fact. A manager walks by, sees the
stacks, and makes decisions based on a reality that hasn’t existed for
six months. The board doesn’t just fail to help — it actively
misleads.
The fix: Assign ownership. One person — a team
leader, a continuous improvement coordinator, a shift supervisor — is
responsible for updating the board whenever the process changes. This
means: new or removed tasks, changed cycle times, relocated work
elements, staffing changes. The board is a living document or it is
nothing.
The Strips Are Lies
A Yamazumi board is only as accurate as the data behind it. And
here’s the uncomfortable truth: most teams build their boards from
estimates, not measurements.
A supervisor sits at a desk with a process flowchart and writes down
how long each step “should” take. Operators nod when asked if the
numbers look right because they’ve learned that disagreeing extends the
meeting. The strips are cut, colored, and mounted. The board looks
beautiful.
And every number on it is wrong.
Cycle times measured by stopwatch on the gemba floor routinely differ
from engineered standards by 20-40%. Not because the standards were
poorly calculated, but because real work includes micro-stoppages,
material handling, quality checks, conversations, walk time, and a
hundred other micro-activities that don’t appear in the SOP.
When you build a Yamazumi from standards instead of observation,
you’re balancing a line that doesn’t exist.
The fix: Time studies first. Stand on the floor with
a stopwatch and a clipboard. Time each task multiple times across
multiple cycles, multiple operators, and multiple shifts. Record the
actual work — including the stuff that isn’t in the documentation. Build
the board from reality, not aspiration. And when the process changes, go
back to the floor and measure again.
Nobody Moves the Strips
The Yamazumi board’s greatest power is its interactivity. During a
kaizen event or a weekly improvement huddle, the team should be
physically rearranging the board: “What if we move this quality check
from Station 3 to Station 2? What if we split this assembly task? What
if we parallel this operation?”
This is called yamazumi analysis — the active, iterative
process of simulating line balance changes by moving strips before
moving work.
In practice, this almost never happens.
The board gets mounted on a wall. People look at it. Someone says
“Station 4 is overloaded.” Everyone agrees. The meeting ends. The strips
stay exactly where they were.
The board has become a display when it was designed to be a
workspace. It’s as if you bought a whiteboard and only ever
looked at it — never picked up a marker.
The fix: Use the board. Run monthly (at minimum)
line-balancing reviews where the explicit goal is to physically
rearrange strips, simulate the new balance, calculate the projected
cycle time improvement, and then — critically — implement the changes on
the floor and measure the results. A board that drives no changes to the
physical process is theater.
The Color Coding Is Ignored
The red-yellow-green system on a Yamazumi board isn’t decorative.
It’s diagnostic.
- Green: Value-added work. The customer is paying for
this. Cutting, welding, assembling, testing. - Yellow: Incidental work. Necessary but
non-value-added. Walking, loading fixtures, entering data, retrieving
materials. - Red: Pure waste. Waiting, rework, searching for
tools, double-handling, unnecessary inspection.
When a team uses the colors correctly, the board immediately reveals
what kind of problem each station has. A station with a tall
stack of green strips is a capacity constraint — you need to offload
work. A station with a tall stack of yellow strips has a process design
problem — you need to eliminate unnecessary handling. A station with red
strips has a systemic failure — you need to ask why waste is built into
the standard.
Most teams ignore the color system entirely. They use one color —
usually whatever sticky notes were in the supply closet. The board shows
height but not composition. You can see that a station is
overloaded, but not why. The improvement conversation starts
one step behind where it should.
The fix: Color the strips. It takes five extra
minutes during construction and transforms the analytical value of the
board. If your current board is monochrome, go back and recolor it this
week. The patterns will surprise you — stations you thought were
capacity-constrained are often drowning in yellow incidental work that
can be eliminated without touching the value-added content at all.
The Board Balances the Wrong
Line
Here’s a subtle one. A team builds a Yamazumi board for their
assembly line. They balance it beautifully — every station within 5% of
takt time. The board is a work of art.
But the line they balanced is for Product A. And Product A accounts
for 30% of their actual production volume.
The other 70% is Products B, C, and D — each with different task
sequences, different cycle times, and different work distributions. The
“balanced” line is balanced for a product that barely runs.
This is the multi-product trap. Most manufacturing lines don’t
produce a single SKU. They run a mix. And a Yamazumi board that
represents only one product’s work content is a partial truth — and a
partial truth, in manufacturing, can be more dangerous than a complete
ignorance, because it creates the illusion of control.
The fix: Build Yamazumi boards for your full product
mix, or at minimum for your highest-volume and highest-complexity
variants. If you run a mixed-model line, the board needs to show the
weighted average work content per station across the product family.
This is more work — but it’s the only version that reflects operational
reality. A single-product Yamazumi on a mixed-model line isn’t a tool;
it’s a fairy tale.
The Bottleneck Gets
Documented, Not Solved
The Yamazumi board identifies the bottleneck. Everyone can see it —
it’s the tallest column. The team acknowledges it. The supervisor
reports it. The manager includes it in the monthly review.
And there it sits. For months. For years.
The tallest column on the board never gets shorter. It becomes a
permanent feature of the landscape — “Oh, that’s Station 6, it’s always
been the bottleneck.” People say it the way they’d describe a mountain.
It’s geography. It’s immutable. It’s just the way things are.
This is the most insidious failure mode because it represents the
total inversion of the tool’s purpose. The Yamazumi board was designed
to eliminate bottlenecks, not to catalog them. A
bottleneck that appears on your board in January and is still your
tallest column in June doesn’t have a process problem — it has a
management problem.
The fix: Set a rule: no bottleneck column is allowed
to remain the tallest for more than one improvement cycle (typically
30-90 days). When a bottleneck is identified, it becomes the #1 priority
for the next kaizen event. Resources — engineering, maintenance,
operator training — are directed at that station until it is no longer
the constraint. Then the board is updated, the new bottleneck is
identified, and the cycle repeats. This is the theory of constraints
applied visually, and it’s the entire point of the tool.
The Deeper Pattern
Every failure mode described above shares a common root: the
Yamazumi board is treated as an artifact instead of an
activity.
An artifact is something you create, display, and maintain. It has a
lifecycle: design, build, install, audit. It exists to be observed.
An activity is something you do. It has rhythm: measure, construct,
analyze, rearrange, implement, measure again. It exists to drive
action.
The teams that get value from Yamazumi boards treat them as
activities. The board is never “finished.” It’s a living surface that
reflects current reality and drives current decisions. Strips are added,
removed, moved, and recolored every time the process changes or a kaizen
event runs. The board is messy, dog-eared, and covered in pencil marks —
because it’s being used.
The teams that don’t get value treat the board as an artifact. It was
built during a lean event in 2024. It’s mounted neatly behind
plexiglass. It looks professional. And the process it describes hasn’t
existed for eighteen months.
Rebuilding a Dead YamazumI
Practice
If your Yamazumi boards have become wallpaper, here’s how to revive
them:
Step 1: Tear down the old boards. All of them. If
they haven’t been updated in the last 90 days, they’re fiction. Starting
fresh is better than correcting decayed data.
Step 2: Conduct fresh time studies. Get on the floor
with stopwatches. Measure every task, every station, every product
variant. Record at least 10 cycles per task to capture variation.
Document micro-activities that aren’t in the SOP.
Step 3: Rebuild with discipline. Use the color
system. Include all product variants or a defensible weighted average.
Mount the board at the point of use — on the shop floor, near the line,
where operators and team leaders interact with it daily.
Step 4: Establish the cadence. Weekly: team leader
reviews the board, notes any process changes, updates strips. Monthly:
cross-functional kaizen huddle uses the board to identify and plan
improvement actions. Quarterly: full board reconstruction from fresh
time studies.
Step 5: Track the metrics that matter. Line balance
ratio (lowest station time ÷ highest station time). Bottleneck cycle
time trend. Percentage of red (waste) strips over time. These numbers
tell you whether the board is driving improvement or just decorating a
wall.
The Real Question
A Yamazumi board asks one question, over and over: Why is this
stack taller than the others?
If your organization can answer that question — honestly, repeatedly,
with action — the board is doing its job.
If your organization looks at the tallest stack, shrugs, and says
“that’s just how it is” — then your Yamazumi board isn’t failing. Your
culture is. And no tool, no matter how elegant, can compensate for a
culture that has decided its problems are permanent.
The board is a mirror. It shows you the shape of your process —
lumpy, uneven, wasteful. The question was never whether the mirror
works. The question was always whether you’re willing to look at what it
shows you and do something about it.
Peter Stasko is a Quality Architect with over 25
years of experience in manufacturing quality management, process
improvement, and lean implementation. He has led quality transformations
across automotive, electronics, and industrial manufacturing sectors,
specializing in making tools work the way they were designed to — not
the way they’re usually practiced.