Recovering Statistical Process Control From Compliance Theatre
Why most SPC charts are decorative, how the system degrades, and the specific operational mechanisms required to make control charts…
150 articles
Why most SPC charts are decorative, how the system degrades, and the specific operational mechanisms required to make control charts…
Cp and Cpk values are routinely computed on unstable processes, non-normal data, and unrepresentative samples. Here is how to audit…
How to strip the paperwork out of a stalled DFSS deployment and return the methodology to its core engineering purpose:…
When production scales from a single pilot line to multiple facilities and suppliers, the statistical assumptions behind tolerance analysis break…
A Gage R&R under 10% means nothing if the study was rigged, the parts were hand-picked, and the instrument was…
How to move COQ analysis from political theatre to verifiable financial decisions, using activity-based costing to expose your hidden factory.
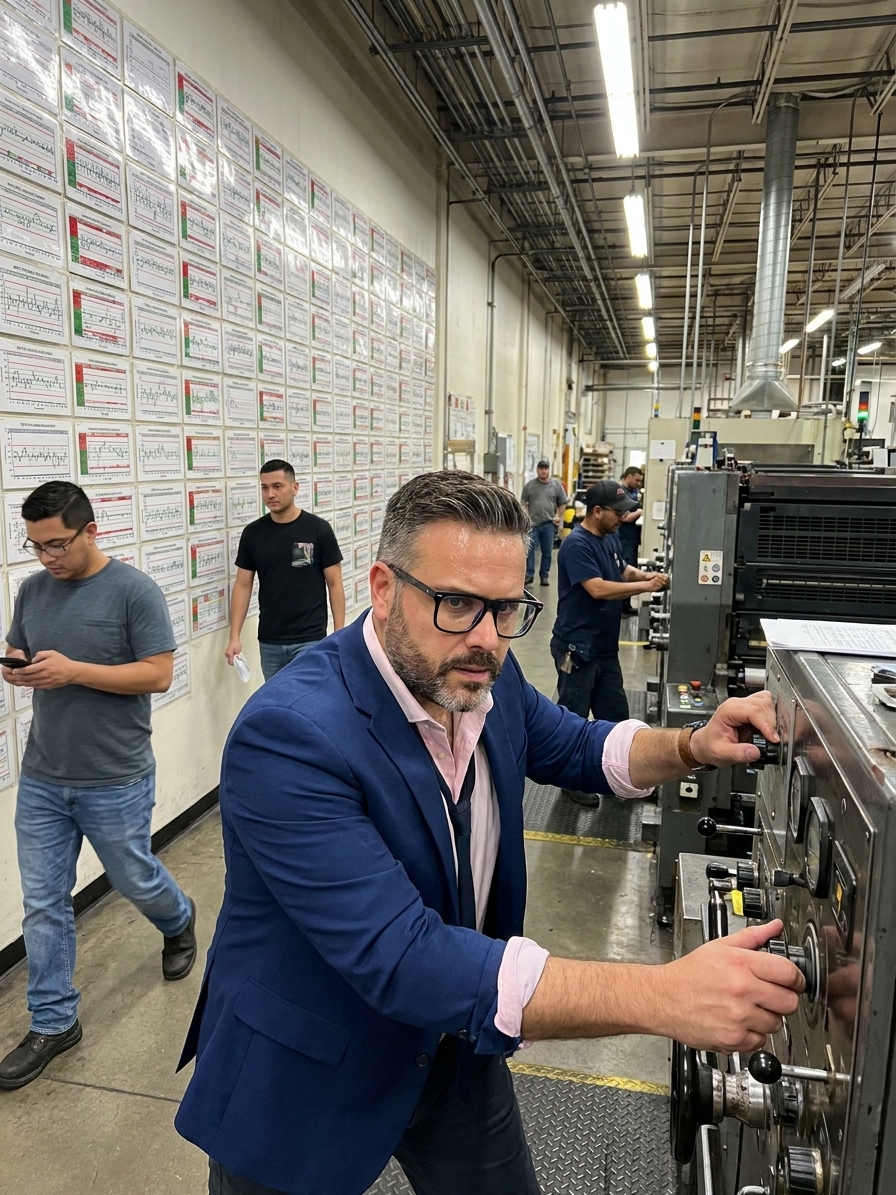
SPC fails not because the statistics are wrong, but because organisations confuse control limits with specification limits and operators with…
Most Cpk values in PPAP packages and management dashboards are unvalidated snapshots. Here are the statistical assumptions quality engineers ignore…
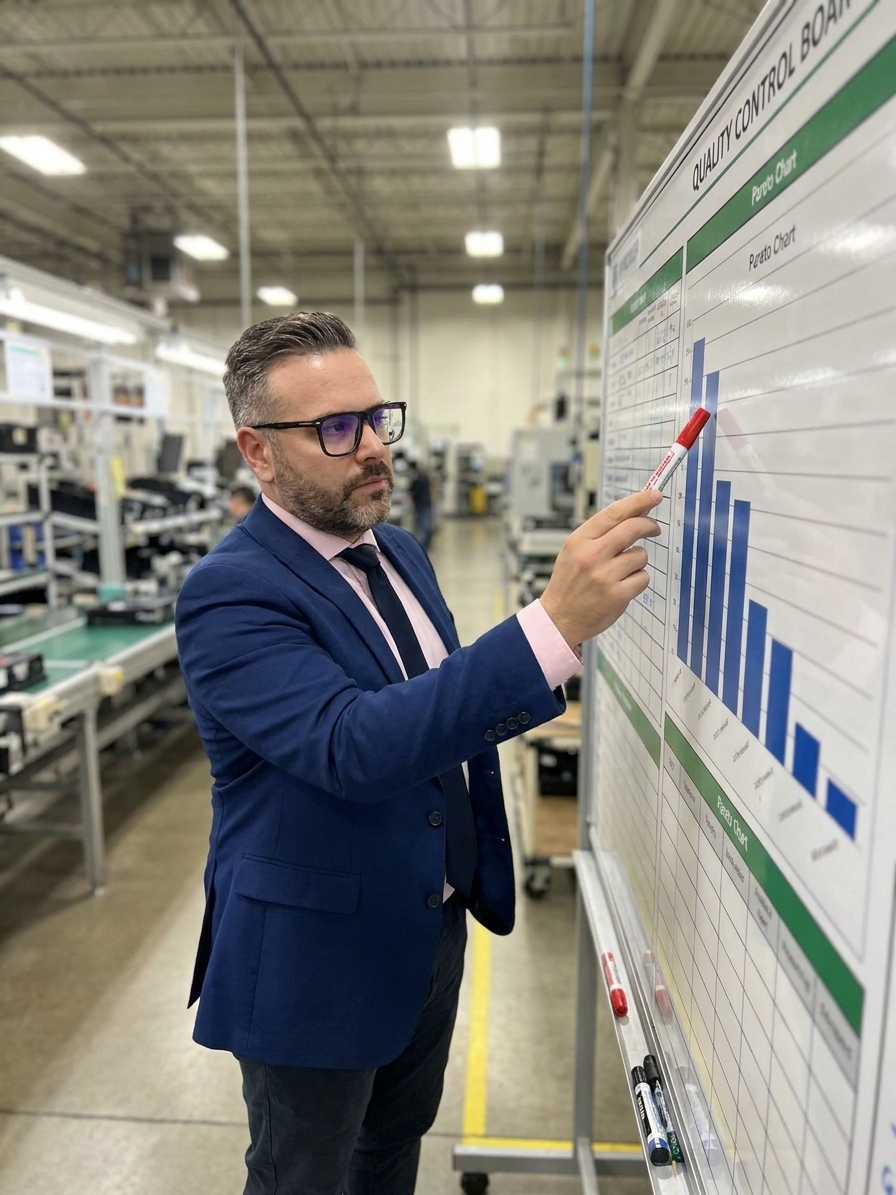
Most manufacturing plants generate Pareto charts that simply confirm existing biases. Here is how to rebuild the 80/20 principle into…
Most SPC programs fail not because the statistics are wrong, but because facilities confuse specification limits with control limits and…