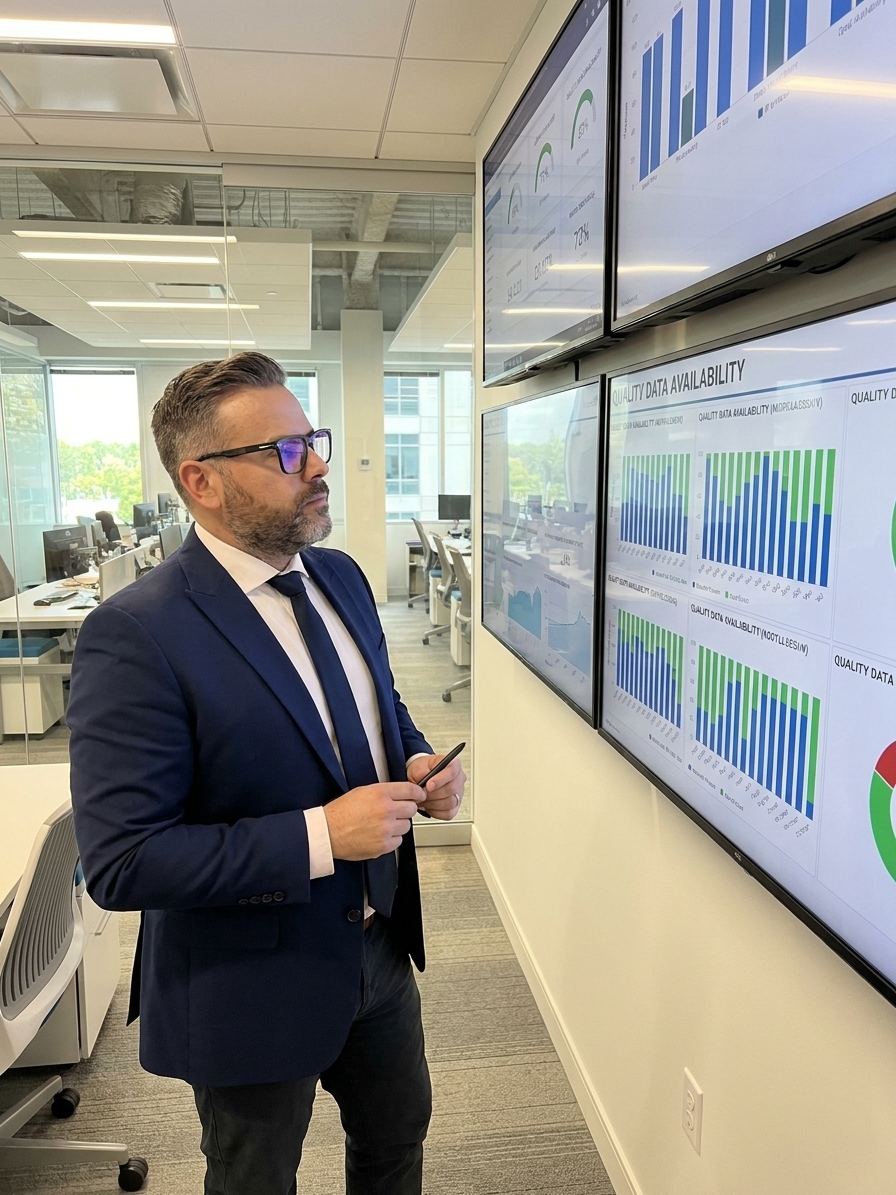
Every manufacturing executive has lived through a version of the same
nightmare. You implement a quality metric. You tie performance
evaluations, bonuses, and promotions to that metric. For a quarter,
maybe two, the numbers improve. Charts trend upward. Presentations look
beautiful. Then the customer complaints start rolling in — not fewer,
but more. The defects you thought you eliminated didn’t disappear. They
migrated, mutated, and multiplied in places your metric couldn’t
see.
This is Goodhart’s Law in action, and it is arguably the most
dangerous force operating in modern quality management today. Named
after the British economist Charles Goodhart, who first articulated it
in 1975, the law states: “When a measure becomes a target, it ceases to
be a good measure.” In manufacturing quality, this principle manifests
with ruthless consistency. The moment you reward people for hitting a
number, they will find ways to hit the number — and those ways may have
nothing to do with actual quality improvement.
The
Mechanism: How Metrics Corrupt the Systems They Measure
Goodhart’s Law operates through a four-stage cycle that repeats
endlessly across manufacturing organizations worldwide.
Stage One: Selection. Leadership selects a metric
they believe represents quality. First-pass yield. Scrap rate. Customer
complaints per thousand units. The metric seems reasonable, even
obvious. It captures something real about the process.
Stage Two: Incentivization. The metric becomes a
target. It appears on scorecards, in performance reviews, on plant-floor
dashboards. Managers start their morning meetings by reviewing it.
Bonuses depend on it. Promotion decisions reference it. The metric is no
longer just a measurement — it is now a lever of organizational
power.
Stage Three: Optimization. People begin optimizing
for the metric rather than for the underlying quality it was supposed to
represent. This is not corruption. This is not laziness. This is
rational human behavior responding to the incentive system you built.
When you tell people that a specific number determines their livelihood,
they will find the most efficient path to making that number look
good.
Stage Four: Degradation. The metric decouples from
reality. The numbers say quality is improving. The product says
otherwise. The gap between what you measure and what is actually
happening grows wider every month, and because your entire management
system is built around the metric, you have no mechanism for seeing what
the metric has become blind to.
The Anatomy
of Metric Corruption in Manufacturing
Consider first-pass yield, one of the most commonly targeted metrics
in discrete manufacturing. The logic seems sound: measure what
percentage of units pass inspection on the first attempt, and you have a
clean proxy for process quality. But the moment you make first-pass
yield a performance target with real consequences, the distortion
begins.
Operators discover that certain types of defects are easier to rework
than to prevent. So they produce units with known, correctable flaws,
rework them offline, and report them as first-pass successes.
Inspectors, under pressure to maintain yield numbers, begin classifying
borderline defects as “within specification” — not because the
specification changed, but because the cost of classifying them as
failures has become personally expensive. Engineers, evaluated on yield
improvement, start lobbying to widen tolerances rather than improve
processes. Each of these behaviors is individually rational. Together,
they transform first-pass yield from a useful quality indicator into a
work of organizational fiction.
Or consider the ubiquitous scrap rate metric. When scrap rate becomes
a KPI with teeth, an entirely predictable set of behaviors emerges.
Rework stations multiply across the plant floor, quietly absorbing
defects that would otherwise be classified as scrap. “Concessions” and
“use-as-is” dispositions increase — material that would once have been
scrapped is now dispositioned as acceptable, often through processes
that are technically compliant but strategically questionable. The scrap
rate goes down. The actual defect rate does not. The rework costs,
hidden in different cost centers, actually increase total manufacturing
cost. But the metric looks beautiful.
Customer complaints per thousand units offers perhaps the most
instructive example. When this metric becomes a target, organizations
don’t reduce complaints — they reduce the recording of
complaints. Customer service representatives are trained to classify
complaints as “inquiries” or “feedback” rather than formal complaints.
Return authorizations are processed through channels that don’t count in
the metric. Thresholds for what constitutes a “reportable” complaint are
raised. The metric improves. The customer experience does not. In some
cases, it actively deteriorates, because the organizational energy that
might have gone into fixing root causes is instead consumed by the
bureaucratic work of keeping the numbers clean.
Why
Goodhart’s Law Is Invisible to the People It Affects
The most insidious aspect of Goodhart’s Law is that it operates
invisibly. The people distorting the metric don’t think of themselves as
distorting anything. They believe they are improving quality, because
the metric says they are. The managers reviewing the metric believe
things are getting better, because the trend lines point upward. The
executives reporting to the board believe the quality initiative is
working, because the dashboard glows green.
Nobody is lying. Nobody is cheating in the traditional sense. What is
happening is more subtle and more dangerous: the organization has
collectively agreed to treat the metric as reality, and because everyone
is incentivized to believe the metric, nobody has the motivation to
question whether it still represents what it was supposed to
represent.
This creates a particularly vicious form of organizational blindness.
The better your metric looks, the less incentive anyone has to
investigate whether it’s still accurate. The worse your actual quality
becomes, the more pressure there is to maintain the appearance of
improvement. The gap between metric and reality grows until it is
finally ruptured by an event too large to hide — a customer audit, a
product recall, a regulatory action, a catastrophic field failure. When
the rupture comes, the organization is always shocked, because the
numbers told a completely different story.
The
Real-World Cost: Beyond Numbers on a Dashboard
The financial cost of Goodhart’s Law in quality management is
staggering, though it rarely appears on any single line item. Consider a
automotive parts manufacturer that targeted zero customer rejects as its
primary quality metric. The plant achieved it — officially — for
eighteen consecutive months. During that same period, internal rework
costs increased by 340%. Warranty claims, processed through a different
reporting channel, tripled. A field failure resulted in a vehicle recall
that cost $47 million. The plant manager, whose bonus was tied to the
customer reject metric, received his performance award three months
before the recall was announced.
Or consider a medical device manufacturer that made complaint closure
time its key quality metric. The metric improved dramatically.
Complaints were closed faster than ever. But the speed came at the
expense of investigation depth. Root cause analyses were truncated.
Corrective actions were superficial. Eighteen months later, the same
failure mode appeared in three different product families, resulting in
a consent decree with the FDA that shut down production for four months
and cost the company over $200 million.
These are not extreme cases. They are typical cases. They happen
because Goodhart’s Law is not a failure of individual character — it is
a structural failure that emerges inevitably whenever a metric becomes a
target.
A Framework for
Resisting Goodhart’s Law
You cannot eliminate Goodhart’s Law. It is a fundamental principle of
how measurement interacts with human behavior. But you can build systems
that resist its most corrosive effects.
Use metric batteries, not single metrics. Never
allow any single quality metric to become the sole basis for performance
evaluation. Instead, create a battery of complementary metrics that
measure the same underlying quality from different angles. First-pass
yield, combined with rework cost, combined with customer return rate,
combined with warranty cost, creates a picture that is much harder to
distort than any single measure. When one metric begins to decouple, the
others provide early warning.
Rotate your metrics. The longer a metric is used as
a target, the more distorted it becomes. Rotate your primary quality
metrics annually or semi-annually. This doesn’t mean abandoning useful
measurements — it means changing which measurements carry the weight of
performance evaluation. Rotation prevents any single metric from
accumulating enough incentive pressure to become deeply corrupted.
Audit the metric, not just the process. Every
quality audit should include an explicit examination of whether the
metrics being reported still accurately represent the reality they are
supposed to capture. This means sampling independently from the
measurement system — conducting your own inspection, your own customer
survey, your own scrap count — and comparing the results to the reported
numbers. Divergence is the early warning sign of Goodhart’s Law at
work.
Separate measurement from incentive. The most
powerful structural defense against Goodhart’s Law is to decouple the
people who measure quality from the people who are incentivized by it.
When the quality organization reports through an independent channel —
not to the plant manager whose bonus depends on the numbers — the
measurement has a chance of remaining honest. This is the same principle
behind financial audit independence, and it works for exactly the same
reasons.
Make the invisible visible. Track the gap between
your metrics and your ground truth. When first-pass yield improves but
warranty costs stay flat, that gap is data. When scrap rate drops but
total manufacturing cost per unit increases, that gap is data. When
customer complaints decrease but customer churn accelerates, that gap is
data. These gaps are your early warning system, and they are more
valuable than any single metric on your dashboard.
Ask the question nobody wants to ask. At every
quality review, someone should be tasked with asking: “What are we not
seeing because we’re not measuring it?” This is the most important
question in quality management, and it is the one most likely to be
suppressed by a metric-driven culture. The defects that don’t appear in
your metrics are the ones that will eventually destroy your quality
reputation.
The Leadership Challenge
Goodhart’s Law presents a particular challenge for quality leaders
because it attacks the very tool that leadership relies on most heavily:
the ability to measure, track, and improve through numerical targets.
Leaders who recognize Goodhart’s Law at work in their organizations face
a difficult choice. They can acknowledge that the metrics they’ve been
celebrating are partially fictional — which requires admitting that
previous improvements were partially illusory. Or they can continue to
believe the numbers, knowing that the gap between metric and reality is
probably growing.
The best quality leaders choose honesty, even when it is politically
painful. They understand that a metric that makes you look good but
doesn’t reflect reality is worse than no metric at all, because it
creates false confidence and suppresses the urgency that real problems
deserve. They are willing to retire metrics that have become targets,
even when those metrics are producing flattering numbers. They are more
interested in the truth than in the trend line.
This is not an argument against measurement. Measurement is the
backbone of quality management. Without metrics, you are navigating
blind. But metrics are instruments, not destinations. They are
compasses, not the territory itself. The moment you confuse the compass
reading with the landscape — the moment you treat the metric as the
quality rather than a signal about the quality — you have entered the
territory of Goodhart’s Law, and the numbers will betray you.
The Deeper Lesson
Goodhart’s Law teaches something fundamental about the nature of
quality that most organizations never learn: quality is not a number.
Quality is a relationship between your product and your customer’s
experience. Numbers can describe that relationship, but they cannot
replace it. When you optimize for the description rather than the thing
being described, you lose the thing itself.
The manufacturers who consistently deliver genuine quality share a
common trait: they use metrics as tools for understanding, not as
instruments of control. They measure relentlessly, but they remain
skeptical of what they measure. They celebrate improvements in their
numbers, but they verify those improvements against reality before they
celebrate. They understand that the most important quality information
is often the information that doesn’t show up in any metric — the
operator’s private concern about a machine that “doesn’t sound right,”
the inspector’s gut feeling that a batch “doesn’t look like it usually
does,” the customer’s vague dissatisfaction that hasn’t yet crystallized
into a formal complaint.
These signals — soft, qualitative, unmeasurable by dashboards — are
the canaries in the coal mine of quality. Goodhart’s Law makes
organizations deaf to canaries, because canaries don’t sing in numbers.
The organizations that listen anyway are the ones that survive.
Peter Stasko is a Quality Architect with over 25
years of experience in manufacturing quality systems, process
optimization, and organizational transformation. He specializes in
helping manufacturers build quality cultures that resist the cognitive
traps and systemic failures that undermine even well-intentioned
organizations.