Quality
and Process Capability: When Your Organization Discovers That Meeting
Specifications Was Never About Trying Harder — It Was About Whether Your
Process Was Ever Capable of Delivering What You Promised
The Line That Changed
Everything
The meeting started the way they always do — with a dashboard full of
green and a quality manager who didn’t believe it.
“We’re at 98.7% first pass yield,” the plant director announced,
tapping the screen like a conductor expecting applause. “Best quarter in
three years.”
Maria, the quality engineering lead, didn’t clap. She pulled a
different chart from her folder — one that wasn’t on any dashboard. It
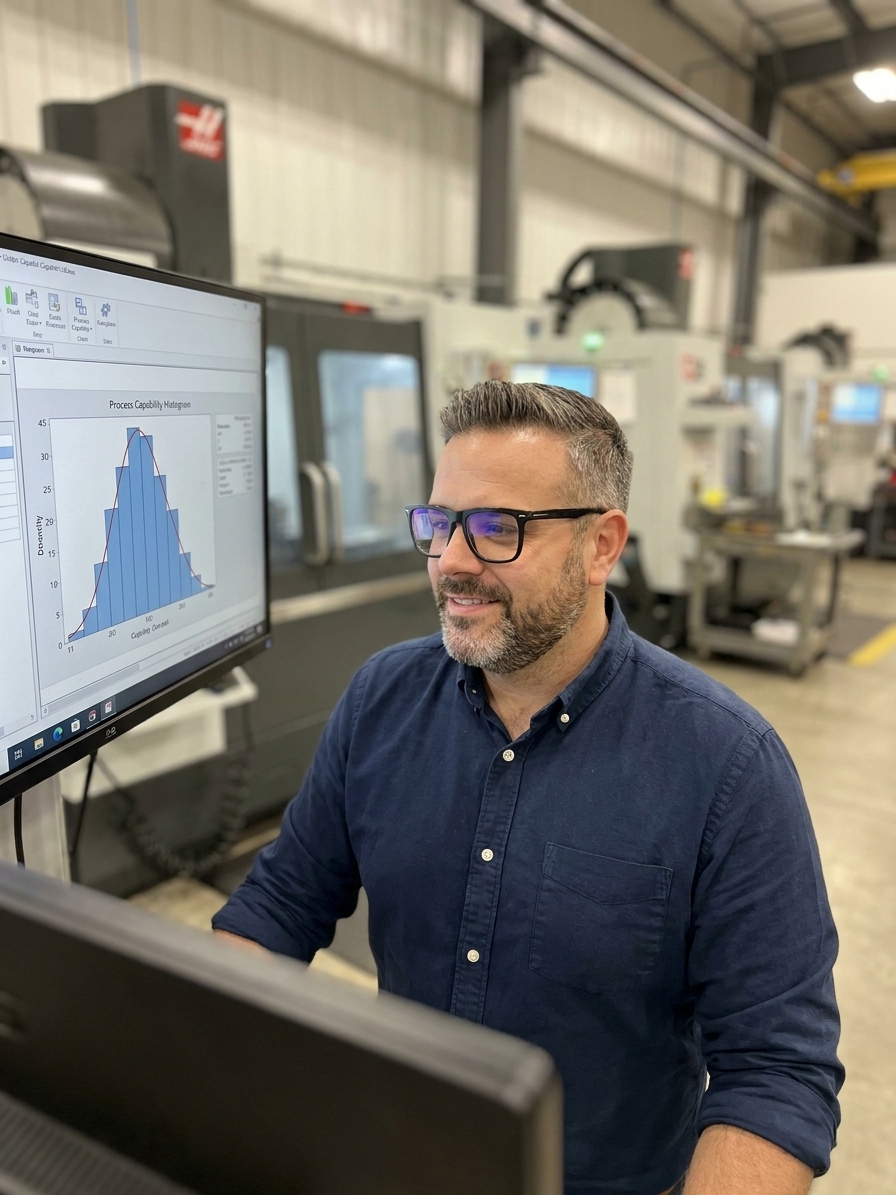
showed a histogram of shaft diameters from Line 7, overlaid with the
specification limits. The distribution was centered. It was symmetrical.
It looked beautiful.
It was also touching both spec limits.
“Every single part is in spec,” Maria said quietly. “But our process
capability index is 1.01. That means we’re one sneeze away from
producing out-of-tolerance parts. Not occasionally. Constantly. We’re
not good — we’re lucky.”
The room went silent. The plant director stared at the histogram like
it was an x-ray revealing a tumor he didn’t know he had.
“Trying harder,” Maria continued, “is not a process control strategy.
The question isn’t whether we’re meeting specs today. The question is
whether our process was ever capable of reliably meeting them. And the
data says it barely is.”
That conversation changed how that plant operated. Not because
someone found a defect. Because someone found the truth hiding behind a
compliant process.
What Process Capability
Actually Means
Here’s the uncomfortable reality that most manufacturing
organizations refuse to face: being in specification is not the
same as being capable.
Process capability is a statistical measure of how much natural
variation your process exhibits relative to the specification limits
you’ve committed to. It answers a simple but devastating question:
Given the way your process naturally behaves, how often will it
produce conforming product — even when everything is running
normally?
The two most common indices are:
-
Cp — measures the potential capability of your
process, assuming it’s perfectly centered between the specification
limits. It’s the ratio of the spec width to the process spread (6σ). A
Cp of 1.0 means your process spread exactly fits within your
specifications — with zero room for error. -
Cpk — measures the actual capability, accounting
for how centered your process is. If your process is shifted toward one
spec limit, your Cpk will be lower than your Cp, even if the spread is
the same.
A Cpk of 1.33 has been the traditional minimum acceptable value in
automotive and aerospace. World-class organizations target Cpk of 1.67
or higher for critical characteristics. Here’s what those numbers
actually mean in human terms:
| Cpk | Parts per Million Out of Spec | What It Feels Like |
|---|---|---|
| 0.67 | ~45,500 | Fighting fires every day |
| 1.00 | ~2,700 | Just barely holding on |
| 1.33 | ~63 | Comfortable but not sleeping well |
| 1.67 | ~0.6 | Actually reliable |
| 2.00 | ~0.002 | World-class |
Look at that jump from Cpk 1.0 to 1.33. You go from 2,700 defective
parts per million to 63. That’s not an incremental improvement — that’s
the difference between a customer who tolerates you and a customer who
trusts you.
The Three Lies
Organizations Tell Themselves
Lie #1: “We’re Meeting
Spec, So We’re Fine”
This is the most dangerous sentence in manufacturing. It confuses
output with capability. Meeting specification today tells you nothing
about tomorrow. A process with a Cpk of 0.8 can produce a week of
conforming parts through sheer statistical luck. Then Monday arrives,
the material batch shifts slightly, the ambient temperature changes two
degrees, and you’re scrap.
The truth: Specification compliance is a lagging
indicator. Process capability is a leading one. If you only track
whether parts pass inspection, you’re driving by looking in the rearview
mirror.
Lie #2: “Our
Operators Just Need to Be More Careful”
When a process isn’t capable, organizations instinctively blame the
people running it. They add inspection steps. They write new work
instructions. They put up signs that say “QUALITY IS EVERYONE’S
RESPONSIBILITY” in bold letters. None of this makes the process more
capable.
The truth: If your process capability index is below
1.0, no amount of human attentiveness will save you. You cannot inspect
quality into a product when the process that creates it fundamentally
cannot deliver what’s required. The variation is built into the system.
The operator is not the variable — the process is.
Lie #3: “We’ll Fix It When
We Have Time”
Process capability studies are treated as academic exercises —
something to do during slow periods or when a customer audit is coming.
The assumption is that capability problems are theoretical risks, not
present realities.
The truth: Every day you operate an incapable
process, you’re gambling. Not metaphorically. Literally. You’re betting
that today’s natural variation won’t drift far enough to produce
nonconforming product. And unlike most gambles, the odds are published
in your own data — you just haven’t calculated them.
The Story of Line 4
A medical device manufacturer had four assembly lines producing the
same catheter. Lines 1, 2, and 3 were running at Cpk values between 1.4
and 1.6 — solid, reliable, boring in the best possible way.
Line 4 was at Cpk 0.93.
For eighteen months, the team managed Line 4 differently. They added
an extra inspector. They increased the sampling frequency. They held
daily huddles to discuss “defect trends.” They had more meetings about
Line 4 than Lines 1, 2, and 3 combined.
Then someone asked the obvious question: “Why is Line 4
different?”
The answer wasn’t operator error. It wasn’t motivation. It wasn’t
even training. It was a worn tooling fixture that introduced a
systematic bias into the alignment step. The fixture had been out of
spec for so long that the process had been compensating around it —
creating a shifted distribution that barely fit within the tolerance
window.
A $4,200 fixture replacement brought Line 4 from Cpk 0.93 to Cpk 1.52
in one shift. The extra inspector was reassigned. The daily huddles
stopped. The defect rate dropped by 94%.
For eighteen months, they had been managing a problem that didn’t
need managing. It needed fixing.
How to Actually
Do Process Capability Analysis
Step 1: Verify
Measurement System Adequacy
This is the step everyone skips — and it invalidates everything that
follows. Before you study process capability, you must confirm that your
measurement system can reliably detect the variation you’re trying to
analyze. Run a Gage R&R study first. If your measurement system
contributes more than 10% of total observed variation, your capability
indices are measuring noise, not process performance.
I’ve seen organizations celebrate a Cpk of 1.8 that turned out to be
0.9 once the measurement error was subtracted. The process hadn’t
improved — the measurement system had been lying to them.
Step 2: Verify Process
Stability
Process capability assumes your process is in statistical control —
that the variation you’re observing is common cause (inherent to the
process) rather than special cause (due to specific, identifiable
factors). Run a control chart first. If you see trends, shifts, cycles,
or out-of-control points, your process isn’t stable, and your capability
index is meaningless.
Calculating Cpk on an unstable process is like measuring the average
temperature of a room where someone keeps opening and closing the
window. The number you get is technically a number. It just doesn’t mean
anything.
Step 3: Collect Sufficient
Data
You need enough data to characterize the distribution. For
normal-process assumptions, 50-100 individual measurements is typically
sufficient, though more is always better. The data should be
consecutive, representing normal production conditions — not
cherry-picked, not from a special setup, not from a single shift when
the best operator was running.
Step 4: Check Normality
Process capability indices assume normal distribution. Many
manufacturing processes aren’t normal — they’re skewed, bounded, or
follow different distributions entirely. Use a normality test
(Anderson-Darling, Shapiro-Wilk) before applying standard capability
calculations. If your data isn’t normal, use appropriate transformations
or non-normal capability methods.
Step 5: Calculate and
Interpret
Calculate Cp and Cpk. Look at both. If Cp is high but Cpk is low,
your process spread is acceptable but your process is off-center — a
relatively easy fix. If both are low, your process has too much
variation — a harder problem that requires fundamental process
improvement.
The Hidden Cost of
Incapable Processes
Organizations that ignore process capability pay for it in ways that
never appear on any single report:
Scrap and rework are the obvious costs. But they’re
the small costs. The real damage is in the invisible overhead: the extra
inspections, the containment actions, the emergency team meetings, the
customer visits to “discuss quality performance,” the warranty claims,
the second shifts running to make up for what the first shift
scrapped.
I once calculated the total cost of managing an incapable process at
an automotive supplier. The direct scrap cost was $340,000 per year. The
cost of all the activities deployed to manage that incapability — extra
inspections, sorting, containment, expediting, customer communication,
management attention — was $1.2 million. They were spending nearly four
times the scrap cost just coping with a problem they refused to solve at
its source.
Customer trust is the invisible cost that compounds.
Your customers don’t see your Cpk values. They see the occasional defect
that slips through. And each one erodes their confidence a little more,
until one day the next supplier audit isn’t a formality — it’s a search
for a replacement.
Short-Term vs. Long-Term
Capability
Here’s a nuance that trips up even experienced quality professionals:
Cpk is a short-term snapshot. It tells you how capable your process is
right now, under current conditions. Long-term capability (Ppk, or
Process Performance Index) accounts for all the variation that
accumulates over time — tool wear, material lot changes, operator
differences, ambient conditions, setup variations, and a hundred other
factors that shift and drift your process over weeks and months.
The relationship between short-term and long-term capability is often
expressed as a 1.5σ shift — a rule of thumb suggesting that long-term
variation is about 1.5 standard deviations wider than short-term
variation. This means a Cpk of 1.33 (short-term) might degrade to an
effective long-term capability closer to 1.0.
This is why world-class organizations don’t celebrate a Cpk of 1.33.
They know it’s the minimum, not the target. They design processes with
enough capability margin that normal degradation, material variation,
and the chaos of real-world manufacturing still leave them comfortably
within specification.
What World-Class
Organizations Do Differently
The best organizations I’ve worked with share a common trait:
they don’t use process capability as a report — they use it as a
design tool.
They don’t wait until production to discover whether a process is
capable. They design capability into the process from the beginning.
They set machine specifications, select tooling, design fixtures, and
choose materials with capability in mind. They run preliminary
capability studies during PPAP. They set minimum capability thresholds
not just for production processes but for the equipment and tooling that
enable them.
And they make capability data visible — not buried in a quality
engineer’s spreadsheet, but posted at the line, reviewed in production
meetings, tracked as a key performance indicator alongside OEE and
delivery.
A Practical Starting Point
If your organization hasn’t systematically evaluated process
capability, here’s where to start:
- Pick your top 5 critical characteristics — the
dimensions or parameters that matter most to your customer - Run capability studies on each one — following the
steps above, including measurement system analysis and stability
verification - Rank them by Cpk — lowest to highest
- Attack the bottom — your lowest Cpk processes are
your biggest risks and often your biggest opportunities - Set a minimum Cpk of 1.33 for critical
characteristics and 1.67 for safety-critical ones - Review capability monthly — not as a report, but as
a decision-making tool
The organizations that do this consistently don’t have fewer
problems. They have fewer surprises. And in quality, the absence of
surprises is the presence of excellence.
The Bottom Line
Process capability isn’t a statistical exercise. It’s a honesty test.
It forces your organization to confront the gap between what it promises
to deliver and what its processes can actually produce reliably. That
gap is where scrap lives, where rework breeds, where customer complaints
originate, and where your best people burn out managing problems that
shouldn’t exist.
Maria was right in that meeting. Trying harder isn’t a strategy. Luck
isn’t a control plan. And a process that barely fits within your
specifications isn’t a capable process — it’s a ticking clock.
The only question is whether you’ll hear it ticking before it goes
off.
Peter Stasko is a Quality Architect with 25+ years of experience
transforming organizations across automotive, aerospace, and
pharmaceutical industries. He has led process capability initiatives
that reduced scrap by over 60% and helped organizations move from
reactive inspection to proactive process control. His approach combines
deep statistical expertise with the practical understanding that data
only matters when it changes decisions.