You spent three days in a conference room with a consultant. You
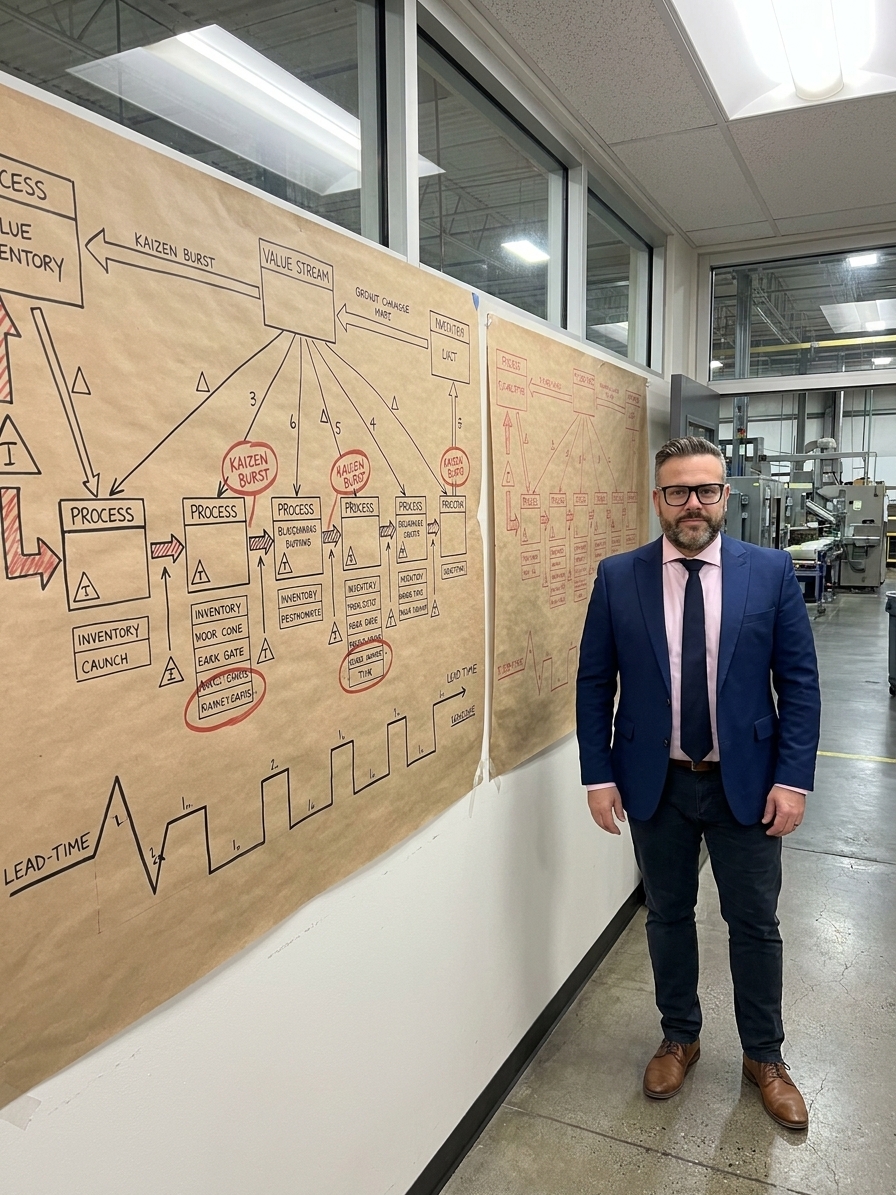
walked the floor with stopwatches and clipboards. You drew boxes,
triangles, and jagged lightning bolts on butcher paper that stretched
across an entire wall. You calculated takt time, cycle time, lead time,
and inventory turns. You identified fourteen types of waste. You felt
the energy in the room — finally, someone was looking at the whole
picture, not just their own workstation.
Then the consultant left. The butcher paper stayed on the wall for
six months. Nobody looked at it again. The future-state map you drew so
carefully in red marker became a faded relic that the cleaning crew
eventually took down. The waste you identified with such precision
continued exactly as before. The only thing that changed was that you
could now say, with complete sincerity, “We did value stream
mapping.”
This is the story of Value Stream Mapping in most organizations. Not
the success story from the textbook — the real story. The one where a
powerful diagnostic tool becomes an academic exercise that changes
nothing. Where the act of mapping substitutes for the act of improving.
Where the waste you so carefully documented on paper continues
uninterrupted in reality, and the map itself becomes the most expensive
piece of wall art your company ever purchased.
What Value Stream Mapping
Actually Is
Value Stream Mapping is a lean manufacturing technique developed at
Toyota (where it is called material and information flow
mapping) that visualizes the entire flow of materials and
information required to bring a product from raw material to customer
delivery. Unlike process flowcharts, which show only the sequence of
operations, a value stream map shows:
-
Material flow: How raw materials move through
each process step, including inventory accumulations between stations,
push versus pull connections, and supplier-to-customer
throughput. -
Information flow: How production control signals
travel — schedules, kanban cards, electronic orders, forecasts — and
critically, whether each step is producing based on a push system
(making to a schedule) or a pull system (making based on downstream
consumption). -
The data box: Cycle time, changeover time,
uptime, batch sizes, scrap rate, number of operators, and available work
time for each process step — the quantitative backbone that reveals
where time is actually spent. -
The timeline: A sawtooth chart at the bottom of
the map that separates processing time (value-added) from waiting time
(non-value-added), typically revealing that less than 5% of total lead
time is actual processing — a statistic that should horrify any
operations leader seeing it for the first time.
The output of VSM is not the current-state map. The output is the
future-state map — a redesigned value stream that
eliminates waste, establishes flow, introduces pull where appropriate,
and drives toward continuous flow and leveled production. The
current-state map is the diagnosis; the future-state map is the
prescription. Implementation is the cure.
Except in most organizations, implementation never happens. And the
diagnosis becomes the deliverable.
How VSM Actually
Unfolds in Most Organizations
Phase 1: The Event
It starts with enthusiasm. An executive read about VSM in a lean book
or saw it at a conference. A kaizen event is scheduled. A
cross-functional team is assembled — operations, quality, engineering,
materials, sometimes finance. An external facilitator is brought in,
because nobody internally has done this before.
The team walks the floor. They time processes. They count inventory.
They ask operators questions that reveal how little anyone understands
about what happens two stations upstream or downstream from their own
area. They discover that the production control department issues
schedules that nobody follows, that inventory between Assembly and Test
has been growing for three years, and that the supplier lead time
everyone assumes is two weeks is actually five.
This part is genuinely valuable. The walking, the observing, the
timing — this is real gemba work. People see the value stream for the
first time as a connected whole rather than as isolated departments. The
awareness alone feels transformative.
Phase 2: The Map
The team reconvenes in a conference room and begins drawing. The map
takes shape over two or three days. Boxes for processes. Triangles for
inventory. Arrows for information flow. Lightning bolts for kaizen
bursts — improvement opportunities identified along the way.
The data boxes get filled in. Lead time is calculated. The team
discovers that a product with 45 minutes of actual processing time has a
total lead time of 23 days. The room goes quiet. Someone says, “We had
no idea.” This moment of revelation — the gap between processing time
and lead time — is the emotional peak of the entire VSM experience. It
is also, in most organizations, the last moment anything real
happens.
The future-state map is drawn. Kaizen bursts are circled. An
implementation plan is sketched. The facilitator packs up, bills the
engagement, and tells the executive that the real work begins now.
Phase 3: The Fade
In the first week after the event, there is momentum. The
implementation plan is distributed. Someone is assigned to each kaizen
burst. A few quick wins are attempted — maybe a 5S cleanup of an
inventory accumulation point, maybe a kanban card trial between two
stations.
Then the first obstacle appears. The ERP system cannot easily support
pull signals. The supplier does not want to change their delivery
frequency. The production supervisor who was not in the mapping event
(because only one supervisor was invited) does not understand the
future-state map and continues scheduling as before. The engineering
team has a capacity constraint and cannot implement the fixture redesign
that was supposed to reduce changeover time at Press #3.
The implementation plan slips. Week by week, the energy dissipates.
The kaizen bursts on the map remain unburstable. The future-state map,
so carefully drawn in red marker, becomes an aspiration rather than a
plan. Within three months, the map on the wall is just decoration.
Within six months, it is taken down to make room for a safety poster.
Within a year, nobody remembers where the map is stored, and when a new
consultant suggests doing VSM, nobody mentions that it was already
done.
This is not a failure of the tool. It is a failure of the
organization. But the distinction rarely matters, because the waste
continues either way.
Why VSM Fails: The Real
Reasons
1. Mapping Without Authority
The most common failure mode is that the mapping team has the
authority to diagnose but not to change. They can walk the floor, time
processes, and draw maps, but they cannot change the ERP system,
renegotiate supplier contracts, reassign operators, reconfigure
equipment, or override production schedules. The future-state map
identifies changes that require decisions from people who were not in
the room and who have no particular interest in disrupting their
department to implement someone else’s vision.
At Toyota, value stream improvement is led by the line management
itself — the people who own the process are the ones who map it and
change it. In most Western organizations, VSM is delegated to a team of
staff and middle managers who can recommend but not decide. The result
is a beautiful map attached to no accountable owner.
2. The ERP Contradiction
Here is a truth that nobody talks about in lean training: your ERP
system is almost certainly designed for push production, and your
future-state map almost certainly calls for pull production. These two
things are in direct conflict.
Most future-state maps envision some form of pull system — kanban
cards, supermarket inventories, FIFO lanes, or make-to-order triggers at
pacemaker steps. But the ERP system that runs the factory generates work
orders, allocates inventory, and schedules operations based on forecasts
and MRP explosions. Implementing pull means fighting the ERP system at
every step — manually overriding work orders, creating phantom part
numbers to represent kanban loops, running parallel scheduling systems,
or engaging in a multi-year, multi-million-dollar ERP reconfiguration
that nobody wants to fund.
So the pull system stays on the map and the push system stays in the
factory. The future-state map becomes a fictional document that
describes a production system that does not and cannot exist given the
current IT infrastructure. This is not a minor obstacle. It is a
structural barrier that sinks more VSM implementations than any other
single factor.
3. The Current-State
Obsession
Many organizations become fascinated with their current-state map. It
is, after all, a genuinely interesting document — especially the first
time you see one. The revelation of how long things actually take versus
how long you thought they took is powerful.
But the current-state map is a diagnostic, not a result. Spending
three months perfecting the current-state map — adding more detail,
refining data box numbers, mapping additional product families — is
procrastination dressed as diligence. The goal of VSM is not an accurate
current-state map. The goal is a changed future state. Organizations
that perfect the map but never implement the changes have confused the
photograph with the patient.
4. Scope Creep and Map
Complexity
A value stream map should cover one product family on one line. It
should be drawn on a single sheet of paper (large paper, but one sheet).
The map should be readable in five minutes by someone who has never seen
it before.
Instead, what often happens is that the mapping team decides to map
the entire factory. Or multiple product families. Or the entire supply
chain from tier-3 supplier to end customer. The map grows to cover an
entire wall, then two walls. It becomes so complex that nobody can hold
it in their head. The complexity itself becomes a barrier to
implementation — you cannot improve what you cannot even discuss
coherently in a meeting.
Toyota maps one value stream at a time, on one sheet of paper,
focused on one product family. The discipline of scope is part of the
discipline of improvement. When you try to map everything, you improve
nothing.
5. No Follow-Through
Mechanism
The VSM event produces a future-state map and an implementation plan.
What it usually does not produce is a governance mechanism — a standing
team that meets weekly to track implementation, a budget for the
changes, a project manager assigned to drive it, a timeline with
milestones, or an executive sponsor who reviews progress.
Without governance, the implementation plan is a wish list. The
kaizen bursts are suggestions. The future-state map is a dream. Nobody
is accountable, nobody reports progress, nobody escalates blockers, and
nobody measures whether the future state was achieved.
What Real VSM Looks Like
When value stream mapping works, it looks nothing like the
conference-room exercise described above. It looks like this:
It is owned by line management, not by staff. The
person responsible for the value stream — typically a value stream
manager or production manager — leads the mapping, owns the future-state
map, and is accountable for implementation. This is not a delegated
activity; it is a core management responsibility.
It is focused on one product family. The map covers
a specific, manageable scope — not the entire factory. The team can
implement changes within their span of control without needing approval
from five other departments.
It produces a few specific changes, not a comprehensive
transformation. A good future-state map identifies three to
five high-impact changes. Not fourteen kaizen bursts — three to five.
The team implements those changes in 90-day cycles, then re-maps.
Iteration beats ambition.
It includes the IT and supply chain constraints from day
one. The ERP system, the supplier contracts, the equipment
layout — these are not discovered during implementation; they are
understood during mapping. The future-state map accounts for these
constraints or explicitly identifies the work needed to remove them.
It has a follow-up cadence. Weekly reviews of
implementation progress. Monthly adjustments to the plan. Quarterly
re-assessment of the future state. The map is a living document,
reviewed and updated, not a frozen artifact.
The
Deeper Failure: Process Thinking Without Process Maturity
Value Stream Mapping is a tool that assumes a certain level of
organizational maturity. It assumes that the organization can:
- Make cross-functional decisions and enforce them
- Invest in infrastructure changes (ERP, equipment, layout)
- Sustain improvement focus beyond a single event
- Manage by value stream rather than by department
Most organizations that attempt VSM do not have this maturity. They
are functionally organized, departmentally siloed, ERP-locked, and
event-driven in their improvement approach. VSM does not create this
maturity; it exposes the lack of it. The map reveals that your value
stream is broken across three departments with competing priorities,
governed by an IT system that cannot support flow, and managed by people
who have never been asked to think beyond their own area.
This is useful information. But it is not, by itself, improvement.
And in most organizations, the information is gathered, the map is
drawn, the gap is identified — and then the organization continues
exactly as before, because addressing the structural barriers that the
map revealed is far harder than drawing the map that revealed them.
The Cost of VSM Theater
The direct cost of a VSM event — facilitator fees, team time,
conference room, materials — ranges from $15,000 to $50,000 for a
typical mid-size manufacturer. This is the visible cost.
The invisible cost is worse. When an organization invests in VSM and
then fails to implement the findings, it teaches the workforce that
improvement initiatives are performative. The operators who were
interviewed during the mapping event shared real insights about waste
and inefficiency. When nothing changes, they learn that their input does
not matter. The next time someone walks the floor with a clipboard, the
operators will provide rote answers and minimal cooperation, because
they have been trained that the exercise leads nowhere.
This learned cynicism is more damaging than the waste the map
identified. Waste can be eliminated. Cynicism must be unlearned, and
that takes far longer. An organization that has been through three VSM
events with no implementation is harder to improve than one that has
never attempted VSM at all, because the first organization no longer
believes improvement is possible.
How to Do VSM Right:
A Practical Framework
If you are about to attempt value stream mapping, or if you have maps
on the wall that led nowhere, here is what needs to change:
1. Start with one value stream, one owner, one
scope. Pick one product family. Assign one person — a line
manager with real authority — to own the mapping and the implementation.
Keep the scope small enough that the owner can make changes without
multi-department approval.
2. Involve IT and supply chain from the beginning.
Do not discover during implementation that the ERP cannot support pull.
Bring the IT manager and the supply chain manager into the mapping
event. If they cannot commit to the changes needed, the future-state map
must account for that — or the scope must be narrowed to what is
achievable.
3. Limit the future-state map to three to five
changes. Not fifteen kaizen bursts. Three to five specific,
measurable, achievable changes with owners, timelines, and success
metrics. If you cannot narrow it to five, you have not thought hard
enough about priorities.
4. Establish governance before you start
implementation. Weekly 30-minute reviews. Monthly steering
reviews with the executive sponsor. A tracking board — physical or
digital — that shows each change, its owner, its status, and its
measured impact. If there is no governance, there is no
implementation.
5. Re-map every 90 days. The first future-state map
is not the final state. After 90 days of implementation, re-map the
current state. See what changed. Identify the next three to five
changes. Repeat. VSM is not a one-time event; it is a cyclical practice
— the same way Toyota uses it, continuously, as part of routine
management.
6. Measure lead time. The single most powerful
metric in VSM is total lead time versus processing time. If your map
shows 23 days of lead time for 45 minutes of processing, your
implementation should be measured by whether lead time shrinks. Not by
how many kaizen events you held, how many maps you drew, or how many
people you trained. Did lead time go down? If not, the VSM failed,
regardless of how good the maps look.
The Map Is Not the Territory
There is a concept in systems theory: the map is not the territory. A
map is a representation, a simplification, a tool for understanding. It
is not the thing itself. A map of a city helps you navigate, but living
in the map is not the same as living in the city.
Value Stream Mapping is a map. It is an excellent map — arguably the
best tool ever devised for visualizing the flow of materials and
information through a manufacturing process. But it is a map, not the
process. Drawing the map does not change the process. Hanging the map on
the wall does not improve the flow. Training everyone to read the map
does not eliminate the waste.
Only implementation changes the process. Only sustained, governed,
resourced implementation — led by line management, supported by IT and
supply chain, measured by lead time reduction, repeated in cycles — only
that changes anything.
If your organization has maps on the wall and the same lead times it
had before the mapping event, you have not done Value Stream Mapping.
You have done Value Stream Drawing. And the difference between mapping
and drawing is the difference between improvement and decoration.
Peter Stasko is a Quality Architect with over 25
years of experience in manufacturing quality, lean transformation, and
continuous improvement. He has walked more value streams than he can
count and has seen the same patterns of failure repeat across industries
— from automotive to electronics to medical devices. His mission is to
close the gap between knowing about quality tools and actually using
them to improve outcomes.