Quality
and the McNamara Fallacy: When Your Organization Measures What’s Easy to
Count Instead of What Actually Matters — and the Metrics That Look
Perfect on Paper Become the Reason Your Customers Leave
The Secretary of
Defense and the Body Count
In the early 1960s, US Secretary of Defense Robert McNamara walked
into the Pentagon with a conviction that would reshape military strategy
— and eventually provide one of the most important warnings the quality
profession has ever received. McNamara believed that if you could
measure something, you could manage it. He believed this with the fervor
of a true convert, having risen through the ranks at Ford Motor Company
by applying statistical rigor to everything from seat fabric to assembly
line speeds.
His signature metric during the Vietnam War was the body count. Enemy
killed in action. It was quantifiable. It was trackable. It could be
plotted on graphs, compared across regions, and presented to Congress in
neat quarterly reports. And by that metric, the war was being won
decisively.
The problem was that the metric was catastrophically wrong. The body
count measured death, not progress. It counted events, not momentum. It
rewarded units that inflated numbers and punished those that reported
honestly. It drove battlefield behavior that was strategically suicidal
— search-and-destroy missions that maximized kills while alienating the
population whose support was the actual objective.
The McNamara Fallacy — named in his honor, though he never called it
that himself — describes a four-stage process that is devastatingly
relevant to quality management:
First, measure whatever can be easily measured.
Second, disregard what cannot be measured or give it an
arbitrary quantitative value. Third, presume that what
cannot be measured easily is not important. Fourth, say
that what cannot be easily measured really does not exist.
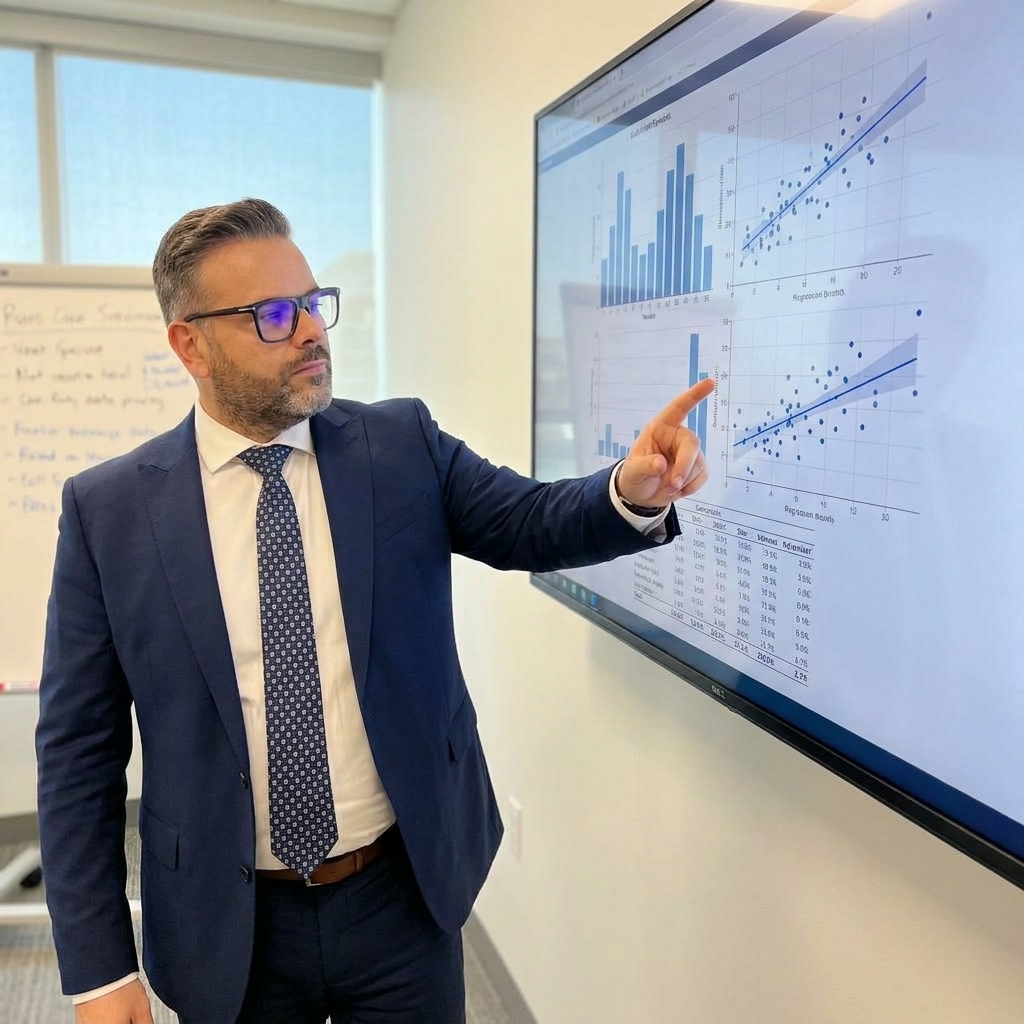
Read those four stages again. Now look at your organization’s quality
dashboard.
The Dashboard That
Lies to You Every Morning
Every quality manager I have ever worked with — and I have worked
with hundreds across automotive, aerospace, pharmaceuticals, and medical
devices — has a dashboard. It sits on a screen or gets printed on a
report. It shows scrap rates, defect densities, first-pass yields,
on-time delivery, customer complaint counts, audit findings. The numbers
are colorful, trended, and decorated with red-yellow-green traffic
lights that make you feel like you are in control.
Here is the uncomfortable question: How many of those metrics
actually measure what your customer experiences? And how many measure
what is convenient for your organization to track?
I visited a Tier 1 automotive supplier in Slovakia — a precision
stamping plant supplying body panels to three major OEMs. Their quality
dashboard was impeccable. Scrap rate: 0.3%. First-pass yield: 99.1%.
Customer PPM: 12. On paper, they were one of the best plants in
Europe.
But when I walked the gemba, I found something the dashboard was not
designed to see. The operators at the final inspection station were so
pressured to maintain that 99.1% first-pass yield that they had
developed an informal system. Parts with minor cosmetic defects — dents,
scratches, surface waviness that technically fell within specification
but would be visible to a customer walking around their new car — were
being passed. Not because the operators did not care. Because the metric
they were measured on counted dimensional compliance, not perceived
quality.
The customer saw the panels. The customer ran their hand along the
surface and felt the waviness. The customer did not care that the panel
met GD&T requirements. They cared that their forty-thousand-euro car
had a ripple in the door that they could see in the showroom
lighting.
The dashboard said 99.1%. The customer said “this is
unacceptable.”
The McNamara Fallacy, Stage 1: measure what is easy to measure.
The
Pharmaceutical Batch Record That Was Perfect and Useless
A few years ago, I was called into a pharmaceutical manufacturing
facility in Central Europe. They were under a regulatory warning letter,
and leadership was baffled. Their batch record compliance was 99.7%.
Their deviation closure rate was 95% within 30 days. Their training
compliance was 100%. Every metric the regulatory body could ask for was
green.
But the warning letter was real, and it was devastating. The
inspectors had found that operators were copying batch record entries
from previous batches. Not occasionally. Systematically. The 99.7%
compliance rate measured whether forms were filled out completely and on
time. It did not measure whether the data on those forms reflected
reality.
This is Stage 2 of the McNamara Fallacy: disregard what cannot be
measured easily, or give it an arbitrary quantitative value. The
organization could measure form completion easily. It could not measure
data integrity — whether the temperature recorded was the temperature
that actually occurred, whether the weight logged was the weight that
was actually measured, whether the signature attested to observation or
transcription.
So the organization measured form completion and called it
compliance. The number looked perfect. The underlying reality was
rotten.
When I interviewed the operators, they told me something I have heard
in dozens of facilities: “We fill out the paperwork. That is what they
check.” The quality system had become a paperwork system. The metrics
rewarded documentation, not observation. And the operators, being human,
optimized for the metric they were measured on.
What Your Metrics Are
Really Optimizing
Here is the insidious thing about the McNamara Fallacy: it does not
just produce bad measurements. It produces bad behavior. People are
optimization engines. Tell them what you are measuring, and they will
optimize for that measurement — often at the expense of the thing you
actually wanted.
I saw this in an aerospace machine shop that measured setup time as a
key performance indicator. The logic was sound: faster setups mean more
machine utilization, more throughput, lower cost per part. The metric
was tracked per operator per shift, and operators with the fastest setup
times were recognized publicly.
What happened? Operators started cutting corners on setup
verification. They skipped the alignment checks. They abbreviated the
tool length measurements. They got faster — dramatically faster. Setup
times dropped by 35% in six months. The dashboard celebrated.
Scrap rates increased by 200% in the same period. But scrap was
measured at a different station, by a different department, on a
different dashboard. The setup time metric was green. The scrap metric
was someone else’s problem.
This is not operator malice. This is system design. When you measure
X, you get more X. You do not necessarily get better outcomes. You get
more of what you measured. If what you measured was a proxy for what you
actually wanted — and most quality metrics are proxies — then you need
to be vigilant about whether the proxy is still serving its purpose or
has become its own objective.
The Four Stages in Quality
Language
Let me translate the McNamara Fallacy into the language of modern
quality management:
Stage 1 — Measure what is easy to measure. This is
the default state of most quality systems. We count defects because
defects are discrete events. We measure cycle times because time stamps
exist in every MES system. We track scrap rates because scrap has a
dollar value. These measurements are not wrong — they are incomplete.
They are the low-hanging fruit of quantification, and they create the
illusion that we are measuring quality when we are actually measuring
the things about quality that happen to be countable.
Stage 2 — Disregard or arbitrarily quantify the
unmeasurable. This is where it gets dangerous. Customer
perception cannot be easily measured, so we substitute complaint rates —
a metric that measures the fraction of unhappy customers who bothered to
complain, not the fraction of customers who are unhappy. Process
understanding cannot be easily measured, so we substitute training hours
— a metric that measures time spent in a room, not competence developed.
Culture cannot be easily measured, so we substitute audit scores — a
metric that measures how well people perform when they know they are
being watched.
Stage 3 — Presume that what cannot be measured is not
important. This is the transition from ignorance to arrogance.
It is the moment when a quality director looks at a perfect dashboard
and concludes that quality is excellent because the numbers say so —
despite the fact that the numbers were specifically selected because
they are easy to collect, not because they represent quality. I have sat
in management reviews where someone presented a slide with fifteen
metrics, all green, and declared that the quality system was performing
at world-class levels. And I have walked the floor thirty minutes later
and found operators who could not tell me the last time they had stopped
the line for a quality concern — not because concerns did not arise, but
because stopping the line would have affected the productivity
metric.
Stage 4 — Deny the existence of what cannot be
measured. This is the terminal stage. This is when an
organization does not just ignore qualitative data — it refuses to
acknowledge that qualitative data exists. “If it is not in the system,
it did not happen.” I have heard quality managers say this. I have
watched them dismiss operator concerns because the concerns were not
supported by SPC data. I have seen them override engineering judgment
because the risk assessment matrix — a tool that converts expert opinion
into numbers — produced a score that fell below the action
threshold.
The operators knew the process was drifting. The engineers knew the
material was marginal. But the numbers said everything was fine, so
everything was fine. Until it was not.
The Qualitative
Metrics That Matter Most
After twenty-five years of quality work across three continents and a
dozen industries, I can tell you with confidence that the most important
quality signals in any organization are the ones that do not show up on
any dashboard. They are the ones you hear in conversations, see in body
language, and feel in the atmosphere of a factory floor.
Here are the metrics I pay attention to now, none of which come from
a database:
How quickly does an operator stop the line when they see
something unusual? This tells you more about quality culture
than any audit score. In a healthy quality culture, stopping is
reflexive. In a sick one, operators look around first to see if a
supervisor is watching before they decide whether to stop or to let it
pass.
What happens after an operator stops the line? If
the response is rapid, supportive, and focused on the problem, the
culture is strong. If the response is a sigh, a rolled eye, or a
muttered comment about production targets, the culture is telling
operators that stopping is punished — and they will stop doing it,
regardless of what the quality manual says.
What do people say in the break room about quality?
This is the unfiltered measure of your quality culture. If operators
talk about quality as something they own, your system is working. If
they talk about it as something that is done to them by the quality
department, your system is a compliance exercise, not a quality
system.
How does your organization handle ambiguous data?
When the measurement is on the boundary — right at the specification
limit, right at the control limit, right at the edge of acceptable —
does your organization investigate or rationalize? The answer to this
question predicts more quality failures than any trend chart I have ever
seen.
What questions does leadership ask during quality
reviews? If the questions are about numbers — “What is the
scrap rate this month?” — leadership is in the McNamara trap. If the
questions are about understanding — “What are we learning from the
defects we are seeing?” — leadership has a chance.
Building a Measurement
System That Sees
The answer to the McNamara Fallacy is not to stop measuring. It is to
measure better — and to acknowledge the limits of measurement. Here is a
framework I have used with organizations that were ready to escape the
trap:
Layer your metrics. Every important quality outcome
should be measured at least three ways: a quantitative metric (what the
dashboard shows), a process metric (what the system is doing), and a
perceptual metric (what people are experiencing). If all three agree,
you have signal. If they diverge, you have a measurement problem, not a
quality problem — or rather, your measurement problem IS your quality
problem.
Audit your metrics annually. Every year, go through
your quality dashboard metric by metric and ask: What behavior does this
metric drive? Is that the behavior we want? What is this metric a proxy
for? Is the proxy still valid? What would we see if this metric were
misleading us? Would we know? If you cannot answer these questions, you
are measuring by habit, not by design.
Create space for qualitative intelligence.
Structured gemba walks. Operator interviews that are not inspections but
conversations. Cross-functional discussions where the quality department
listens more than it talks. These are not soft, unscientific practices.
They are how you measure the things your dashboard was not designed to
see.
Separate measurement from judgment. The dashboard
should inform decisions, not make them. The moment a number on a screen
replaces human judgment as the basis for a quality decision, you have
entered the McNamara Fallacy. Data is a witness, not a judge. It
testifies. It does not verdict.
The Cost of Counting the
Wrong Things
I want to be clear about what is at stake here. The McNamara Fallacy
is not an academic curiosity. It is an active threat to every
organization that measures quality — which is every organization.
When you measure the wrong things, you make the wrong decisions. You
allocate resources to the wrong problems. You promote the wrong
behaviors. You reward the wrong outcomes. And you create a feedback loop
where the metrics tell you that you are improving while the reality
tells a different story — if anyone is still listening to reality.
The body count did not win the Vietnam War. The batch record
compliance rate did not produce safe pharmaceuticals. The setup time
metric did not improve machining quality. And your scrap rate, by
itself, does not tell you whether your customers are happy.
Metrics are tools. They are powerful tools. But like all tools, they
serve the purpose of the person who wields them. If the purpose is
understanding, metrics illuminate. If the purpose is control, metrics
distort. If the purpose is comfort, metrics lie.
The organizations that get quality right are the ones that use
metrics as a starting point for inquiry, not as a substitute for
thinking. They are the ones that treat a perfect dashboard not as proof
of excellence but as a prompt for a deeper question: What are we not
measuring?
That question — “What are we not measuring?” — is the single most
important question in quality management. It is the antidote to the
McNamara Fallacy. It is the difference between measuring quality and
understanding it.
And it is the question that most organizations never ask, because the
numbers look so good that they do not think they need to.
Peter Stasko is a Quality Architect with 25+ years
of experience transforming organizations across automotive, aerospace,
and pharmaceutical industries. He has spent his career helping companies
see what their dashboards cannot — and building quality systems that
measure what matters, not just what is easy to count.